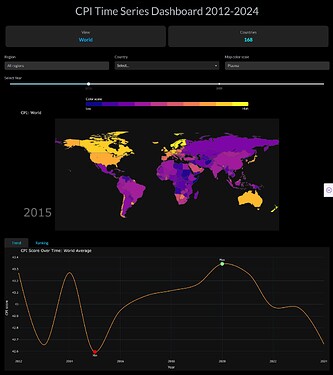
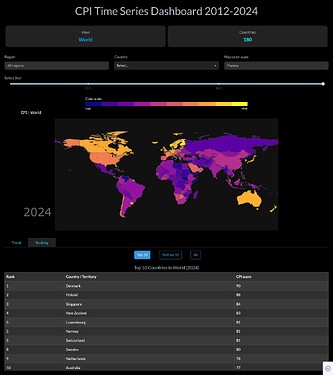
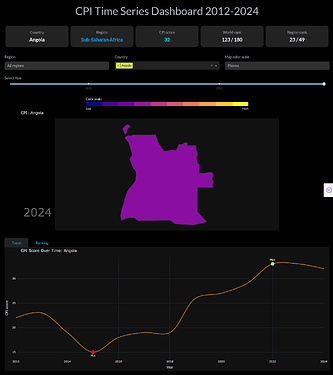
Code
import plotly.express as px
import plotly.graph_objects as go
import dash
from dash import dcc, html, Input, Output
import dash_bootstrap_components as dbc
# Adatok betöltése
df = pd.read_csv("CPI-historical.csv")
all_years = sorted(df["Year"].unique())
all_regions = sorted(df["Region"].dropna().unique())
all_countries = sorted(df["Country / Territory"].dropna().unique())
latest_year = max(all_years)
min_year = min(all_years)
region_names = {
"WE/EU": "Western Europe / European Union",
"AP": "Asia Pacific",
"AME": "Americas",
"SSA": "Sub-Saharan Africa",
"MENA": "Middle East & North Africa",
"ECA": "Eastern Europe & Central Asia",
}
color_scales = {
"Plasma": px.colors.sequential.Plasma,
"Viridis": px.colors.sequential.Viridis,
"Cividis": px.colors.sequential.Cividis,
"Turbo": px.colors.sequential.Turbo,
"Magma": px.colors.sequential.Magma,
}
def kpi_box(label, value, color="#fff"):
return html.Div(
[
html.Div(
label,
style={
"fontSize": "1.05rem",
"color": "#aaa",
"marginBottom": "0.2rem",
},
),
html.Div(
str(value),
style={
"fontSize": "1.35rem",
"color": color,
"fontWeight": "bold",
},
),
],
style={
"backgroundColor": "#222",
"borderRadius": "12px",
"padding": "1.1rem",
"margin": "0.3rem",
"boxSizing": "border-box",
"flex": "1 1 200px",
"minWidth": "200px",
"boxShadow": "0 2px 8px #0002",
"textAlign": "center",
},
)
def aggregate_kpi_panel(dff, view_name):
num_countries = dff["Country / Territory"].nunique()
kpis = [
kpi_box("View", view_name, color="#0af"),
kpi_box("Countries", num_countries, color="#0ff"),
]
return html.Div(
kpis,
style={
"display": "flex",
"flexWrap": "wrap",
"alignItems": "stretch",
"margin": "0.5rem 0 1.2rem 0",
"width": "100%",
},
)
def single_country_kpi_panel(country, year, df):
row = df[(df["Country / Territory"] == country) & (df["Year"] == year)]
if row.empty:
return html.Div("No data for this selection.")
row_data = row.iloc[0]
region = row_data["Region"]
region_label = region_names.get(region, region)
world_df = df[df["Year"] == year].sort_values(
"CPI score", ascending=False
)
world_rank = (
world_df.reset_index(drop=True)
.reset_index()
.set_index("Country / Territory")
.loc[country, "index"]
+ 1
)
world_total = world_df.shape[0]
region_df = world_df[world_df["Region"] == region]
region_rank = (
region_df.reset_index(drop=True)
.reset_index()
.set_index("Country / Territory")
.loc[country, "index"]
+ 1
)
region_total = region_df.shape[0]
kpis = [
kpi_box("Country", country),
kpi_box("Region", region_label, color="#0af"),
kpi_box("CPI score", row_data["CPI score"], color="#0ff"),
kpi_box("World rank", f"{world_rank} / {world_total}"),
kpi_box("Region rank", f"{region_rank} / {region_total}"),
]
return html.Div(
kpis,
style={
"display": "flex",
"flexWrap": "wrap",
"alignItems": "stretch",
"margin": "0.5rem 0 1.2rem 0",
"width": "100%",
},
)
def color_scale_legend(scale_name):
colors = color_scales[scale_name]
n = len(colors)
return html.Div(
[
html.Div(
"Color scale:",
style={
"color": "#fff",
"fontSize": "0.9rem",
"marginBottom": "0.2rem",
},
),
html.Div(
[
html.Div(
style={
"display": "inline-block",
"width": f"{100/n}%",
"height": "18px",
"backgroundColor": color,
}
)
for color in colors
],
style={
"width": "100%",
"display": "flex",
"borderRadius": "4px",
"overflow": "hidden",
"boxShadow": "0 0 2px #333",
},
),
html.Div(
[
html.Span(
"Low",
style={
"color": "#fff",
"fontSize": "0.8rem",
"float": "left",
},
),
html.Span(
"High",
style={
"color": "#fff",
"fontSize": "0.8rem",
"float": "right",
},
),
],
style={
"width": "100%",
"marginTop": "2px",
"clear": "both",
},
),
],
style={"width": "50%", "margin": "0 auto 1rem auto"},
)
def get_line_color(selected_scale):
scale = color_scales[selected_scale]
idx = int(len(scale) * 0.7) if len(scale) > 4 else len(scale) // 2
return [scale[idx]]
app = dash.Dash(
__name__,
external_stylesheets=[dbc.themes.DARKLY],
meta_tags=[
{"name": "viewport", "content": "width=device-width, initial-scale=1.0"}
],
)
server = app.server
app.layout = html.Div(
[
dbc.Container(
[
dbc.Row(
[
dbc.Col(
html.H1(
"CPI Time Series Dashboard 2012-2024",
className="text-center text-light mb-4",
),
width=12,
)
]
),
dbc.Row(
[
dbc.Col(
html.Div(id="kpi-panel", style={"width": "100%"}),
width=12,
)
],
className="mb-2",
),
dbc.Row(
[
dbc.Col(
[
dbc.Label("Region", className="text-light"),
dbc.Select(
id="region-select",
options=[
{"label": "All regions", "value": "all"}
]
+ [
{
"label": region_names.get(r, r),
"value": r,
}
for r in all_regions
],
value="all",
className="bg-dark text-light",
),
],
lg=4,
md=6,
xs=12,
className="mb-2",
),
dbc.Col(
[
dbc.Label("Country", className="text-light"),
dcc.Dropdown(
id="country-select",
options=[
{"label": c, "value": c}
for c in all_countries
],
value=[],
multi=True,
),
],
lg=4,
md=6,
xs=12,
className="mb-2",
),
dbc.Col(
[
dbc.Label(
"Map color scale", className="text-light"
),
dbc.Select(
id="color-scale-select",
options=[
{"label": k, "value": k}
for k in color_scales.keys()
],
value="Plasma",
className="bg-dark text-light",
),
],
lg=4,
md=12,
xs=12,
className="mb-2",
),
],
className="mb-3",
),
dbc.Row(
[
dbc.Col(
[
dbc.Label("Select Year", className="text-light"),
dcc.Slider(
id="year-slider",
min=min_year,
max=latest_year,
value=latest_year,
marks={
str(year): str(year)
for year in all_years
if year % 5 == 0
},
step=1,
),
],
width=12,
)
],
className="mb-4",
),
dbc.Row(
[
dbc.Col(
[
html.Div(id="color-legend-div"),
dcc.Graph(
id="map-chart",
config={"displayModeBar": False},
style={"height": "550px"},
),
],
width=12,
)
],
className="mb-4",
),
dbc.Row(
[
dbc.Col(
[
dbc.Tabs(
[
dbc.Tab(
label="Trend",
children=[
dcc.Graph(
id="line-chart",
config={
"displayModeBar": False
},
style={"height": "550px"},
)
],
tab_id="tab-trend",
label_style={"color": "#0cf"},
),
# MÓDOSÍTÁS: Ranking fül tartalma
dbc.Tab(
label="Ranking",
children=[
dbc.RadioItems(
id="ranking-mode-select",
options=[
{
"label": "Top 10",
"value": "Top 10",
},
{
"label": "Bottom 10",
"value": "Bottom 10",
},
{
"label": "All",
"value": "All",
},
],
value="Top 10",
inline=True,
className="dbc d-flex justify-content-center my-3",
inputClassName="btn-check",
labelClassName="btn btn-outline-info",
),
html.Div(
id="ranking-grid-container",
style={
"height": "480px",
"overflowY": "auto",
},
),
],
tab_id="tab-ranking",
label_style={"color": "#0cf"},
),
]
)
],
width=12,
)
],
),
],
fluid=True,
style={"backgroundColor": "#000", "padding": "20px"},
)
],
style={"backgroundColor": "#000"},
)
@app.callback(
Output("country-select", "options"),
Output("country-select", "value"),
Input("region-select", "value"),
Input("country-select", "value"),
)
def update_country_options(selected_region, current_countries):
if selected_region == "all":
options = [{"label": c, "value": c} for c in all_countries]
value = current_countries
else:
region_countries = sorted(
df[df["Region"] == selected_region]["Country / Territory"]
.dropna()
.unique()
)
options = [{"label": c, "value": c} for c in region_countries]
value = [c for c in current_countries if c in region_countries]
return options, value
@app.callback(
Output("map-chart", "figure"),
Output("line-chart", "figure"),
Output("color-legend-div", "children"),
Output("kpi-panel", "children"),
Output("ranking-grid-container", "children"),
Input("country-select", "value"),
Input("region-select", "value"),
Input("color-scale-select", "value"),
Input("ranking-mode-select", "value"),
Input("year-slider", "value"),
)
def update_dashboard(
selected_countries,
selected_region,
selected_scale,
ranking_mode,
selected_year,
):
dff_full_year = df[df["Year"] == selected_year]
# --- Ranking grid (táblázat) generálása ---
if selected_region == "all":
dff_ranking_context = dff_full_year
ranking_context_name = "World"
else:
dff_ranking_context = dff_full_year[
dff_full_year["Region"] == selected_region
]
ranking_context_name = region_names.get(selected_region)
ranked_df = dff_ranking_context.copy()
ranked_df["Rank"] = (
ranked_df["CPI score"]
.rank(method="min", ascending=False)
.astype(int)
)
if ranking_mode == "Top 10":
ranking_data = ranked_df.sort_values(
"CPI score", ascending=False
).head(10)
title_text = (
f"Top 10 Countries in {ranking_context_name} ({selected_year})"
)
elif ranking_mode == "Bottom 10":
ranking_data = ranked_df.sort_values("CPI score", ascending=True).head(
10
)
title_text = (
f"Bottom 10 Countries in {ranking_context_name} ({selected_year})"
)
else: # "All" opció
ranking_data = ranked_df.sort_values("CPI score", ascending=False)
title_text = (
f"All Countries in {ranking_context_name} ({selected_year})"
)
display_df = ranking_data[["Rank", "Country / Territory", "CPI score"]]
ranking_grid = dbc.Table.from_dataframe(
display_df,
striped=True,
bordered=True,
hover=True,
color="dark",
responsive=True,
)
ranking_output = html.Div(
[html.H5(title_text, className="text-center text-light mt-2"), ranking_grid]
)
# --- Térkép, vonaldiagram és KPI logika ---
line_fig = px.line(
title="Select country/countries to see trend"
).update_layout(
template="plotly_dark",
plot_bgcolor="#111",
paper_bgcolor="#111",
)
if len(selected_countries) > 1:
dff_map = dff_full_year[
dff_full_year["Country / Territory"].isin(selected_countries)
]
map_title = "CPI: Multiple Countries Selected"
dff_line = df[df["Country / Territory"].isin(selected_countries)]
line_fig = px.line(
dff_line,
x="Year",
y="CPI score",
color="Country / Territory",
title="CPI Score Comparison",
markers=False,
line_shape="spline",
)
kpi_panel = aggregate_kpi_panel(dff_map, "Custom Selection")
for country in selected_countries:
country_df = dff_line[dff_line["Country / Territory"] == country]
if not country_df.empty:
min_row = country_df.loc[country_df["CPI score"].idxmin()]
max_row = country_df.loc[country_df["CPI score"].idxmax()]
line_fig.add_trace(
go.Scatter(
x=[min_row["Year"]],
y=[min_row["CPI score"]],
mode="markers",
marker=dict(color="red", size=14, symbol="circle"),
hoverinfo="skip",
showlegend=False,
)
)
line_fig.add_trace(
go.Scatter(
x=[max_row["Year"]],
y=[max_row["CPI score"]],
mode="markers",
marker=dict(
color="lightgreen", size=14, symbol="circle"
),
hoverinfo="skip",
showlegend=False,
)
)
elif len(selected_countries) == 1:
country = selected_countries[0]
dff_map = dff_full_year[dff_full_year["Country / Territory"] == country]
map_title = f"CPI: {country}"
dff_line = df[df["Country / Territory"] == country]
line_color = get_line_color(selected_scale)
line_fig = px.line(
dff_line,
x="Year",
y="CPI score",
title=f"CPI Score Over Time: {country}",
markers=False,
line_shape="spline",
color_discrete_sequence=line_color,
)
kpi_panel = single_country_kpi_panel(country, selected_year, df)
if not dff_line.empty:
min_score_row = dff_line.loc[dff_line["CPI score"].idxmin()]
max_score_row = dff_line.loc[dff_line["CPI score"].idxmax()]
line_fig.add_trace(
go.Scatter(
x=[min_score_row["Year"]],
y=[min_score_row["CPI score"]],
mode="markers+text",
marker=dict(color="red", size=16, symbol="circle"),
text=["Min"],
textposition="bottom center",
showlegend=False,
)
)
line_fig.add_trace(
go.Scatter(
x=[max_score_row["Year"]],
y=[max_score_row["CPI score"]],
mode="markers+text",
marker=dict(
color="lightgreen", size=16, symbol="circle"
),
text=["Max"],
textposition="top center",
showlegend=False,
)
)
else:
if selected_region == "all":
dff_map = dff_full_year
map_title = "CPI: World"
dff_line = (
df.groupby("Year").agg({"CPI score": "mean"}).reset_index()
)
line_title = "CPI Score Over Time: World Average"
kpi_panel = aggregate_kpi_panel(dff_map, "World")
else:
dff_map = dff_full_year[dff_full_year["Region"] == selected_region]
map_title = f"CPI: {region_names.get(selected_region)}"
dff_line = (
df[df["Region"] == selected_region]
.groupby("Year")
.agg({"CPI score": "mean"})
.reset_index()
)
line_title = f"CPI Score: {region_names.get(selected_region)} (average)"
kpi_panel = aggregate_kpi_panel(
dff_map, region_names.get(selected_region)
)
line_color = get_line_color(selected_scale)
line_fig = px.line(
dff_line,
x="Year",
y="CPI score",
title=line_title,
markers=False,
line_shape="spline",
color_discrete_sequence=line_color,
)
if not dff_line.empty:
min_score_row = dff_line.loc[dff_line["CPI score"].idxmin()]
max_score_row = dff_line.loc[dff_line["CPI score"].idxmax()]
line_fig.add_trace(
go.Scatter(
x=[min_score_row["Year"]],
y=[min_score_row["CPI score"]],
mode="markers+text",
marker=dict(color="red", size=16, symbol="circle"),
text=["Min"],
textposition="bottom center",
showlegend=False,
)
)
line_fig.add_trace(
go.Scatter(
x=[max_score_row["Year"]],
y=[max_score_row["CPI score"]],
mode="markers+text",
marker=dict(
color="lightgreen", size=16, symbol="circle"
),
text=["Max"],
textposition="top center",
showlegend=False,
)
)
map_fig = px.choropleth(
dff_map,
locations="ISO3",
color="CPI score",
hover_name="Country / Territory",
color_continuous_scale=color_scales[selected_scale],
range_color=(df["CPI score"].min(), df["CPI score"].max()),
title=map_title,
)
map_fig.update_geos(
showcoastlines=False,
showland=True,
fitbounds="locations",
showcountries=False,
showframe=False,
)
map_fig.update_layout(
template="plotly_dark",
plot_bgcolor="#000",
paper_bgcolor="#000",
font_color="#fff",
margin=dict(l=10, r=10, t=40, b=10),
coloraxis_showscale=False,
)
map_fig.add_annotation(
x=0.05,
y=0.1,
text=str(selected_year),
showarrow=False,
font=dict(size=50, color="rgba(255, 255, 255, 0.4)"),
xref="paper",
yref="paper",
)
line_fig.update_traces(line=dict(width=2))
line_fig.update_layout(
template="plotly_dark",
plot_bgcolor="#111",
paper_bgcolor="#111",
font_color="#fff",
margin=dict(l=10, r=10, t=40, b=10),
)
legend = color_scale_legend(selected_scale)
return map_fig, line_fig, legend, kpi_panel, ranking_output
if __name__ == "__main__":
app.run(debug=True) ```
![]() If you prefer to collaborate with others on Discord, join the Plotly Discord channel.
If you prefer to collaborate with others on Discord, join the Plotly Discord channel.


