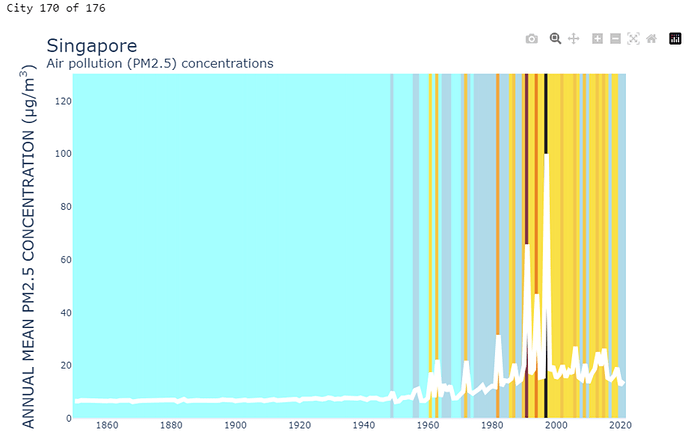
UDATE Sept 8: I have reproduced the chart-sample offered with figure friday week 36. The color stripes were implemented with fig.add_vrect. Each rectangle spans an x-range of year-0.5 to year+0.5. I used MS-Paint to clone the color mapping. The rectangles were added in a loop over each year in the data set. This solution is not very pythonic, but it works. Could surely use some optimization.
I was skeptical about the value of this visualization in real world context, but after working on this I have come to see that it is a pretty cool was to enhance a single-trace line graph and now have ideas about how to use in my real work.
The updated code produces both of the visualizations pasted below, in reverse order.
Here is a view of Bejing with storytelling. I left off the color stripes. Will try adding them as a next task.
Here is the code:
import polars as pl
import polars.selectors as cs
import plotly.express as px
import numpy as np

# colors were cloned using MS-Paint Eye Dropper tool
my_color_dict = {
    '5 - 10' :  '#A4FFFF',
    '10 - 15':  '#B0DAE9',
    '15 - 20':  '#F9E047',
    '20 - 30':  '#F2C84B',
    '30 - 40':  '#F1A63F',
    '40 - 50':  '#E98725',
    '50 - 60':  '#AF4553',
    '60 - 70':  '#863B47',
    '70 - 80':  '#673A3D',
    '80 - 90':  '#462F30',
    '90 -   ':  '#252424',
}

#------------------------------------------------------------------------------#
#     Load the data                                                            #
#------------------------------------------------------------------------------#
c = 'Beijing, China'
df_pollution = (
    pl.scan_csv('air-pollution.csv')   # Lazy Frame
    .select(pl.col('Year', c))
    # .with_columns(color_index = (pl.col(c)/5).cast(pl.UInt8))
    .with_columns(BIN = pl.lit('UNDEFINED'))   #initialize new BIN column
    .with_columns(
        BIN = pl.when(pl.col(c).is_between(0, 5, closed='right'))
                .then(pl.lit(' < 5')).otherwise('BIN')
    )
    .with_columns(
        BIN = pl.when(pl.col(c).is_between(5, 10, closed='right'))
                .then(pl.lit('5 - 10')).otherwise('BIN')
    )
    .with_columns(
        BIN = pl.when(pl.col(c).is_between(10, 15, closed='right'))
                .then(pl.lit('10 - 15')).otherwise('BIN')
    )
    .with_columns(
        BIN = pl.when(pl.col(c).is_between(15, 20, closed='right'))
                .then(pl.lit('15 - 20')).otherwise('BIN')
    )
    .with_columns(
        BIN = pl.when(pl.col(c).is_between(20, 30, closed='right'))
                .then(pl.lit('20 - 30')).otherwise('BIN')
    )
    .with_columns(
        BIN = pl.when(pl.col(c).is_between(30, 40, closed='right'))
                .then(pl.lit('30 - 40')).otherwise('BIN')
    )
    .with_columns(
        BIN = pl.when(pl.col(c).is_between(40, 50, closed='right'))
                .then(pl.lit('40 - 50')).otherwise('BIN')
    )
    .with_columns(
        BIN = pl.when(pl.col(c).is_between(50, 60, closed='right'))
                .then(pl.lit('50 - 60')).otherwise('BIN')
    )
    .with_columns(
        BIN = pl.when(pl.col(c).is_between(60, 70, closed='right'))
                .then(pl.lit('60 - 70')).otherwise('BIN')
    )
    .with_columns(
        BIN = pl.when(pl.col(c).is_between(70, 80, closed='right'))
                .then(pl.lit('70 - 80')).otherwise('BIN')
    )
    .with_columns(
        BIN = pl.when(pl.col(c).is_between(80, 90, closed='right'))
                .then(pl.lit('80 - 90')).otherwise('BIN')
    )

    .collect() # Run Query, return Dataframe
)

def add_annotation(ig, annotation, align, xanchor, yanchor, x, xref, y, yref,   xshift=0, font_size=14):
    ''' Generic function to place text on plotly figures '''
    fig.add_annotation(
        text=annotation,
        xref = xref, x=x, yref = yref, y=y,
        align= align, xanchor=xanchor, yanchor=yanchor,
        font =  {'size': font_size, 'color': 'darkslategray'},
        showarrow=False,
        xshift = xshift
    )
    return fig

#------------------------------------------------------------------------------#
#     setup px.scatter                                                         #
#------------------------------------------------------------------------------#
fig = px.scatter(
    df_pollution,
    'Year',
    'Beijing, China',
)
my_title = 'Beijing, China<br>'
my_title += '<sup>Air pollution (PM2.5) concentrations</sup><br>'
fig.update_layout(
    template='plotly_white',
    height=800,
    width=1200,
    title=my_title,
    title_font=dict(size=24),
    yaxis_title='Annual Mean PM2.5 Concentration'.upper() + ' (μg/m<sup>3</sup>)',
    xaxis_title='',
    yaxis_title_font=dict(size=20),
    yaxis_range=[0,85],
)

customdata = np.stack(
    (
        df_pollution['Year'],
        df_pollution['Beijing, China']
    ),
    axis=-1
)

hovertemplate = (
    '<b>%{customdata[0]}</b><br>' +
    'PM2.5 Concentration: %{customdata[1]:,.1f}<br>' +
    '<extra></extra>')

fig.update_traces(
    mode='lines',
    marker=dict(size=12, line=dict(width=0)),
    customdata=customdata,
    hovertemplate=hovertemplate
    )

#------------------------------------------------------------------------------#
#     add vertical lines to mark key timepoints, and label them                #
#------------------------------------------------------------------------------#
year=1949
y_pos=30
fig.add_scatter(
    x=[year,year], y=[0,y_pos], # vertical line based on 2-point scatter
    mode='lines',line_width=1, line_dash="dash", line_color='gray',
    showlegend=False
)
annotation = f'<b>{year}:</b><br>Establishment of PRC'
fig = add_annotation(
    fig,
    annotation,
    'right',   # align
    'right',   # xanchor
    'middle',  # yachnor
    xref ='x',  x= year,
    yref = 'y', y= y_pos,
    xshift=-5
)

year=2015
y_pos=100
fig.add_scatter(
    x=[year,year], y=[0,y_pos],  # vertical line based on 2-point scatter
    mode='lines',line_width=4, line_dash="dash", line_color='green',showlegend=False
)
annotation = f"<b>{year}:</b><br>Environmental Protection<br>Law revised"
fig = add_annotation(
    fig,
    annotation,
    'right',   # align
    'right',   # xanchor
    'middle',  # yachnor
    xref ='x',  x= year,
    yref = 'y', y= 20,
    xshift=-5
)

#------------------------------------------------------------------------------#
#     place descriptive annotations at various locations                       #
#------------------------------------------------------------------------------#
annotation = '<b>北京中国:</b> steady pollution increases started with the<br>'
annotation += 'establishment of PRC. Significant drop since 2015 coincides<br>'
annotation += 'with a revised environmental protection law.<br>'
fig = add_annotation(
    fig,
    annotation,
    'left',   # align
    'left',   # xanchor
    'middle',  # yachnor
    xref ='paper',  x= 0.3,
    yref = 'paper', y= 0.7,
    xshift=-5,
    font_size = 16
)

fig.update_xaxes(showgrid=False)
fig.update_yaxes(showgrid=False)
fig.show()


#------------------------------------------------------------------------------#
#     setup px.scatter with color stripes, no annotations                      #
#------------------------------------------------------------------------------#
fig = px.scatter(
    df_pollution,
    'Year',
    'Beijing, China',
)
fig.update_traces(line=dict(color='white',width=6))

my_title = 'Beijing, China<br>'
my_title += '<sup>Air pollution (PM2.5) concentrations</sup><br>'
fig.update_layout(
    template='plotly_white',
    height=600,
    width=900,
    title=my_title,
    title_font=dict(size=24),
    yaxis_title='Annual Mean PM2.5 Concentration'.upper() + ' (μg/m<sup>3</sup>)',
    xaxis_title='',
    yaxis_title_font=dict(size=20),
    yaxis_range=[0,85],
)

customdata = np.stack(
    (
        df_pollution['Year'],
        df_pollution['Beijing, China']
    ),
    axis=-1
)

hovertemplate = (
    '<b>%{customdata[0]}</b><br>' +
    'PM2.5 Concentration: %{customdata[1]:,.1f}<br>' +
    '<extra></extra>')

fig.update_traces(
    mode='lines',
    customdata=customdata,
    hovertemplate=hovertemplate,
    )

#------------------------------------------------------------------------------#
#     add a box of width 1 above each year, use color_dict for shading value   #
#------------------------------------------------------------------------------#
for year in df_pollution['Year'].to_list():
    my_bin = df_pollution.filter(pl.col('Year') == year).select(pl.col('BIN')).to_series()[0]
    my_color = my_color_dict.get(my_bin)
    fig.add_vrect(
        x0=year-0.5, x1=year+0.5,
        fillcolor=my_color, #  opacity=0.5,
        layer="below",
        line_color=my_color,
    )

fig.data = fig.data[::-1]
fig.update_xaxes(showgrid=False)
fig.update_yaxes(showgrid=False)
fig.show()
![]() If you prefer to collaborate with others on Discord, join the Plotly Discord channel .
If you prefer to collaborate with others on Discord, join the Plotly Discord channel .


