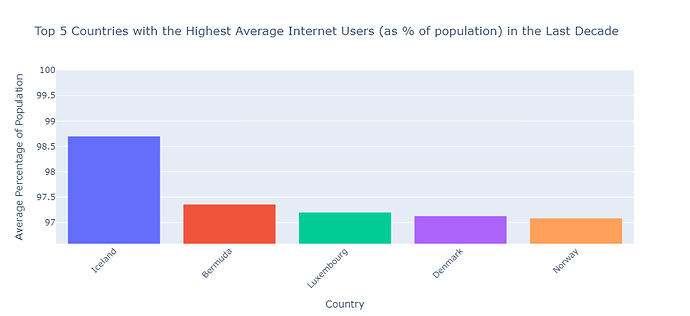
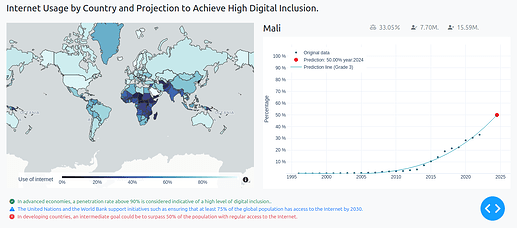
I tried to find a metric that allows us to rank the internet growth by country but I couldn’t, so any ideas? In the meanwhile I’ve added some meta data from the same repository, just to plot a choropleth map. There are other ‘groupers’ to take a look, as well. So, If copied this code take into account the path to WorldData Metadata repo.
The code has a lot of commented code, just in case I get back to it… 
Code
"""Just importing modules"""
from dash import Dash, dcc, html, Input, Output, State
import dash_bootstrap_components as dbc
import dash_mantine_components as dmc
import plotly.express as px
import plotly.io as pio
import pandas as pd
import numpy as np
from pathlib import Path

pio.templates.default = 'plotly_white'

# np.set_printoptions(suppress=True)

# Original data
df = pd.read_csv("https://raw.githubusercontent.com/plotly/Figure-Friday/refs/heads/main/2024/week-48/API_IT.NET.USER.ZS_DS2_en_csv_v2_2160.csv")

# metadata (complete with URL from WorldDataBank) //
# take into account that the reading in pd.read_csv, the encoding is 'ansi'
# This is a short version with only those columns: ['Code', 'Long Name', 'Income Group', 'Region']
path_meta = Path(r'..\data\World_data_bank_meta_short.csv')
df_meta = pd.read_csv(path_meta, encoding='ansi')
df_meta.dropna(subset='Income Group', axis=0, inplace=True)

# +++++++++++++++++++++++++++++++++++++++++++++++++++++++++++++++++++
## First Part to melt data and plot a line_chart by country
exclude_cols = ['Country Code', 'Indicator Name', 'Indicator Code']
# df[df.columns.difference(exclude_cols, sort=False)]

df_melted = (pd.melt(
    df[df.columns.difference(exclude_cols, sort=False)],
    id_vars=['Country Name'],
    var_name='Year',
    value_name='Quantity'
))

df_melted['Year'] = pd.to_numeric(df_melted['Year'], errors='coerce')
# Drop rows where 'Year' is NaN (non-year columns) or 'Quantity' is NaN
df_melted = df_melted.dropna(subset=['Year', 'Quantity'])


# +++++++++++++++++++++++++++++++++++++++++++++++++++++++++++++++++++
## Second Part to merge with Income and Region Grouper
df_merged = (df
             .merge(df_meta, how='left', left_on='Country Code', right_on='Code')
             )
row_to_drop = df_merged[df_merged['Code'].isna()].index.values
df_merged.drop(index=row_to_drop, axis=0, inplace=True) # type: ignore

# Dropping columns with threshold 9 non-null
dff = (df_merged.dropna(axis=1, thresh=9))

## Melted with groupers
dff2 = (pd.melt(
    dff[dff.columns.difference(exclude_cols+['Long Name', 'Code'], sort=False)],
    id_vars=['Income Group', 'Region', 'Country Name'],
    var_name='Year',
    value_name='Quantity'
))
dff2['Year'] = pd.to_numeric(dff2['Year'], errors='coerce')
dff2.dropna(axis=0, inplace=True, subset='Quantity')

# ++++++++++++++++++++++++++++++++++++++++++++++++++++++++++++++++++++++++
# This dff3 to plot choroplet map with 'Code'
dff3 = (pd.melt(
    dff[dff.columns.difference(exclude_cols+['Income Group', 'Region', 'Long Name'], sort=False)],
    id_vars=['Code','Country Name'],
    var_name='Year',
    value_name='Quantity'
))
dff3['Year'] = pd.to_numeric(dff3['Year'], errors='coerce')
dff3.dropna(axis=0, inplace=True, subset='Quantity')


# ++++++++++++++++++++++++++++++++++++++++++++++++++++++++++++++++++++++++++++
# App Layout
# Initialize Dash app with Bootstrap
app = Dash(__name__, external_stylesheets=[dbc.themes.BOOTSTRAP])

button_1 = dbc.Button(
      "Submit",
      id="submit-button",
      color="primary",
      n_clicks=0,
      className="mt-3")

# Layout definition
app.layout = dbc.Container([
    dbc.Row([
        dbc.Col(html.H3("Global Internet Penetration Dashboard", className="text-start text-primary mb-4"), width=12)
    ]),
    dbc.Row([
        dbc.Col([
            html.Label("Select Countries:"),
            dmc.MultiSelect(
                id="country-dropdown",
                data=[{"label": country, "value": country} for country in df_melted['Country Name'].sort_values().unique()],
                maxSelectedValues=3,
                clearable=True,
                searchable=True,
                placeholder="Select up to 3 countries"
            )
        ], width=5),
        dbc.Col([
            html.Label("Select Year Range:"),
            dcc.RangeSlider(
                id="year-slider",
                min=1990,
                max=2023,
                step=1,
                marks = None,
                # tooltip={
                #     "always_visible": True,
                #     "template": "{value}",
                #     "placement":'bottom',
                # },
                # marks={year: str(year) for year in df_melted['Year'] if (year >= 1990) and  (year%3 == 0)},
                value=[1990, 2023]
            )
        ], width=5),
        dbc.Col(button_1,
            className="text-center",
            width=2
        )
    ]),
    dbc.Row([
        dbc.Col(dcc.Graph(id="time-series-chart"), width=12)
    ]),
    # dbc.Row([
    #     dbc.Col([
    #         html.Label("Select Region:"),
    #         dmc.Select(
    #             id="region-dropdown",
    #             data=[{"label": region, "value": region} for region in dff2['Region'].unique()],
    #             placeholder="Select a region"
    #         )
    #     ], width=6)
    # ]),
    dbc.Row([
        dbc.Col(dcc.Graph(id="region-treemap", figure={}), width=12)
    ]),
    dbc.Row([
        dbc.Col(dcc.Graph(id="yoy-bar-chart", figure={}), width=6),
        dbc.Col(dcc.Graph(id="choropleth-map", figure={}), width=6)
    ]),
    dbc.Row([
        dbc.Col(html.Div(id="summary-statistics"), width=12)
    ])
], fluid=True)

# Callback to update the time-series chart only when submit button is clicked
@app.callback(
    Output("time-series-chart", "figure"),
    [Input("submit-button", "n_clicks")],
    [State("country-dropdown", "value"),
     State("year-slider", "value")]
)
def update_time_series(n_clicks, selected_countries, year_range):
    if not selected_countries or not year_range:
        return px.line(title="Please select countries and year range.")

    # print(year_range, selected_countries)
    filtered_df = df_melted[(df_melted["Year"] >= year_range[0]) & (df_melted["Year"] <= year_range[1])]
    filtered_df = filtered_df[filtered_df["Country Name"].isin(selected_countries)]

    fig = px.line(
        filtered_df,
        x="Year", y="Quantity",
        color="Country Name",
        title="Internet Penetration Over Time",
        markers=True,
        labels={"Quantity": "Internet Penetration (%)", 'Year':''}
    )
    fig.update_layout(hovermode='x')
    return fig

# Callback to update the treemap chart based on region selection
@app.callback(
    Output("region-treemap", "figure"),
    # Input("region-dropdown", "value"),
    Input("year-slider", "value"),
    # prevent_initial_call = True
)
def update_treemap(year_range):
    filtered_df = dff2[(dff2["Year"] >= 1995) & (dff2["Year"] <= 2000)]
    agg_df = filtered_df.groupby("Region").agg({"Quantity": "sum"}).reset_index()
    total_quantity = agg_df["Quantity"].sum()
    agg_df["Proportion"] = (agg_df["Quantity"] / total_quantity) * 100

    fig = px.treemap(
        agg_df,
        path=["Region"],
        values="Proportion",
        title="Proportion of Global Internet Penetration by Continent by year-range",
        color="Proportion",
        color_continuous_scale="sunset_r",
        labels={"Proportion": "Global Share (%)"}
    )
    return fig

# def update_treemap(selected_region, year_range):
#     # print(str(selected_region), year_range)
#     # print(type(selected_region))
#     filtered_df2 = dff2[(dff2["Year"] >= year_range[0]) & (dff2["Year"] <= year_range[1])]
#     if selected_region:
#         filtered_df2 = filtered_df2[filtered_df2["Region"] == selected_region].sort_values(by='Quantity')
#     fig = px.treemap(
#         filtered_df2,
#         path=["Region", "Country Name"],
#         values="Quantity",
#         title=f"Internet Penetration in {selected_region}",
#         color="Quantity",
#         color_continuous_scale='sunset_r'
#     )
#     return fig

# # Callback for updating the YoY growth bar chart
@app.callback(
    Output("yoy-bar-chart", "figure"),
    Input("submit-button", "n_clicks"),
    State("country-dropdown", "value"),
    State("year-slider", "value"),
    prevent_initial_call=True,
)
def update_yoy_chart(n_clicks, selected_countries, year_range):
    filtered_df = dff2[dff2["Country Name"].isin(selected_countries)]
    filtered_df3 = filtered_df.copy()
    filtered_df3["YoY Growth"] = filtered_df3.groupby("Country Name")["Quantity"].pct_change() * 100
    yoy_filtered = filtered_df3[(filtered_df3["Year"] >= year_range[0]) & (filtered_df3["Year"] <= year_range[1])]
    fig = px.bar(
        yoy_filtered, x="Year", y="YoY Growth", color="Country Name",
        barmode='group',
        title="Year-over-Year Growth"
    )
    return fig

# Callback for updating the choropleth map
@app.callback(
    Output("choropleth-map", "figure"),
    Input("submit-button", "n_clicks"),
    State("year-slider", "value"),
    prevent_initial_call=True,
)
def update_choropleth(n_clicks, year_range):
    filtered_df = dff3[dff3["Year"] == year_range[1]]
    fig = px.choropleth(
        filtered_df, locations="Code", locationmode="ISO-3",
        color="Quantity", title=f"Internet Penetration by Region in Y{year_range[1]}"
    )
    return fig

# # Callback for updating the summary statistics
# @app.callback(
#     Output("summary-statistics", "children"),
#     Input("submit-button", "n_clicks"),
#     State("country-dropdown", "value"),
#     State("year-slider", "value"),
#     prevent_initial_call=True,
# )
# def update_summary_stats(n_clicks, selected_countries, year_range):
#     filtered_df = df[df["Country"].isin(selected_countries)]
#     latest_data = filtered_df[filtered_df["Year"] == year_range[1]]
#     stats = []
#     for _, row in latest_data.iterrows():
#         stats.append(html.P(f"{row['Country']}: {row['Quantity']:.2f}% penetration"))
#     return stats

if __name__ == "__main__":
    app.run(debug=True)#, port=8099, jupyter_mode='external')
![]() If you prefer to collaborate with others on Discord, join the Plotly Discord channel.
If you prefer to collaborate with others on Discord, join the Plotly Discord channel.


