Update: Version 1.16.1 has been released since this was posted.
We’re pleased to announce that Dash 1.16.0 is out ![]()
pip install dash==1.16.0
Dash 1.16.0 is a backwards compatible feature release. Highlights include:
 Community contribution from jjaraalm greatly improving the Callback Graph’s Debugging and Performance Tools. View the New Dev Tools Callback Graph docs or view pull request #1179
- Upgrading
dcc.Graphfrom Plotly.js 1.54.7 to Plotly.js 1.55.1. This includes fasterpx.imageand date axis label improvements - Community contribution from @anders.kiaer adding support for Content-Security-Policy hashes on inline scripts
- Fixed a subtle callback bug with when clicking on multiple components at the same time. Originally reported by community member @Michael1 & triaged by community member @AnnMarieW in How to separate parallel/concurrent callbacks (nested elements) in Dash 1.13+? - #3 by Michael1. See @Michael1’s excellent bug report and our fix in #1385.
View the Official Changelog
This is the first Dash release where all of the major features were spearheaded by community members! Many thanks to jjaraalm & @anders.kiaer for their contributions ![]()
Callback Graph’s New Debugging & Performance Tools
This overview is pulled from the official docs of this feature.
The callback graph is a visual representation of your callbacks: which order they are fired in, how long they take, and what data is passed back and forth from the browser to your Python, R, or Julia code. This feature was originally sponsored by a customer in Dash v0.42.0 and was recently improved in this release.
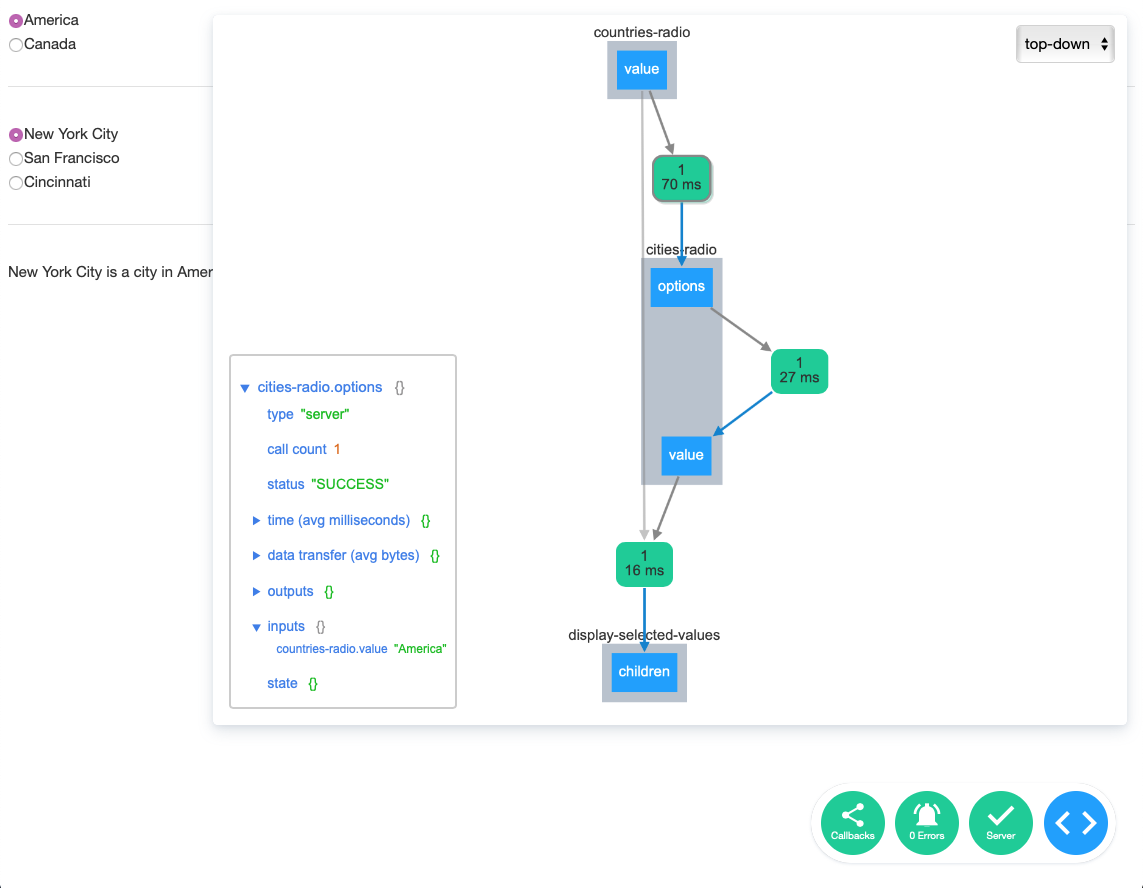
In 1.16.0, the callback graph is now rendered using Cytoscape.js, the network graphing library behind dash-cytoscape. With Cytoscape.js, this graph is now interactive: the elements animate when the callbacks are being fired, you can manually re-arrange elements, and you can click on elements to view timing, performance, & network details of the callback.
60 second video of the feature (no sound)
https://dash.plotly.com/assets/images/devtools/callback-graph.mp4
When you click on a element you’ll see a detailed view of your callback. This detailed view contains things like:
- Call Frequency - How many times the callback has been fired in your session.
- Variable Introspection - The current inputs, outputs, and state of your callback. This can be really helpful if you are puzzled about the shape of the data that is getting passed into your callback or even when you are writing a callback for the first time and want to take a glance at the component’s property.
- Network Time - How long the network request took.
- Compute Time - How long the callback function took.
- Data Transfer - How much data was transferred from the browser to your callback and back.
You can also easily report your own custom timing functions in this view with dash.callback_context.record_timing. For example:
from timeit import default_timer as timer

@app.callback(Output('graph', 'figure'), Input('dropdown', 'value'))
def update_graph(value):
    start_1 = timer()
    # perform some action
    dash.callback_context.record_timing('task_1', timer() - start_1, 'The 1st task')

    start_2 = timer()
    # perform another action
    dash.callback_context.record_timing('task_2', timer() - start_2, 'The 2nd task')

    return px.scatter()
With this, the custom timing data is available in the detailed view:
https://dash.plotly.com/assets/images/devtools/callback-graph-custom-timing-events.png
This is a really easy way to get started debugging the performance of your callback. For example, you might add record_timing calls after a line that does SQL query, a computation, and creating a figure with px.scatter. You can only improve what you can measure!
We’re really excited about how much functionality is packed into this feature. Previously you would’ve had to use some combination of browser’s network tab, custom Python timeit functions, and your own logging to get all of this data. With the Callback Graph, it’s all built-in for free: nothing to configure.
For more details, view our official documentation on this feature, hot off the press!
New Docs on Dash Dev Tools
We revamped our documentation on Dash Dev Tools, our set of debugging and development tools for Dash. It’s much more comprehensive, enjoy the read! ![]()

dcc.Graph Improvements & Plotly.py 4.10
Plotly.py 4.10 was released this week and uses the same version of plotly.js as Dash 1.16.0. The plotly library is used to create the figure that goes into dcc.Graph. Improvements include:
![]()
date -axis and px.timeline() improvements (ticklabelmode='period')


![]() Full Figures for Development
Full Figures for Development

![]() A Faster
A Faster px.imshow()

![]() More details: 📣 Announcing Plotly.py 4.10: date-axis improvements, a Faster px.imshow() and Full Figures for Development
More details: 📣 Announcing Plotly.py 4.10: date-axis improvements, a Faster px.imshow() and Full Figures for Development
Content Security Policy
You can now get CSP script-src hashes of all added inline scripts by calling app.csp_hashes() (both Dash internal inline scripts, and those added with app.clientside_callback.
Some organizations have strict CSP security policies. This feature should help meet those requirements ![]()
Calculate these hashes after all inline callbacks are defined,
and add them to your CSP headers before starting the server, for example
with the flask-talisman package from PyPI:
flask_talisman.Talisman(app.server, content_security_policy={
    "default-src": "'self'",
     "script-src": ["'self'"] + app.csp_hashes()
})
In Other News
-
We recently released
dash-deck, a Dash interface for Uber’s open source 3D & Webgl geospatial librarydeck.gl: 📣 Initial release of Dash Deck, a library for rendering webgl & 3D maps with pydeck and deck.gl in Dash -
We’re making good progress with Dash for Julia. We published the library to Julia’s package manager today! Official docs are coming soon.
-
We recently published AI & ML graphing library docs. Read the announcement or check them out.
-
Our partners in the US Government at IQT made a COVID-19 Diagnostics App. Read about it or tune into our discussion on Wednesday, September 23rd at 2pm EDT
-
On the commercial side, Dash Enterprise 4.0.0 was recently released with support for Data Science Workspaces, Databricks, NVIDIA GPU & RAPIDs support, Embedding, and more. Check in with your customer support rep for official onboarding & upgrade guides or check out our weekly demo.
For more news, follow us on Twitter @plotlygraphs

Previous Releases
- 📣 Dash v1.15.0 Released - Julia Components, Simplified Callback Syntax, Fixed Table Tooltips and Copy & Paste, fixed dcc.Loading styling
- 📣 Dash v1.14.0 Released - Update the Tab's Title, Removing the "Updating..." Messages, Updated DataTable Link Behavior - #5 by stlehmann
- 📣 Dash v1.13.4 Release: Fixes regression with loading states from callbacks with multiple outputs
- 📣 Dash v1.13.3 Release: Improved performance, clientside callback_context, many dcc.Graph & DataTable bug fixes - #11 by Amazigh
- 📣 Dash v1.12.0 Release - Pattern-Matching Callbacks Fixes, Shape-drawing, new DataTable conditional formatting options, prevent_initial_call, and more - #10 by MM-Lehmann
- 📣 Dash v1.11.0 Release - Introducing Pattern-Matching Callbacks
- 📣 Dash v1.10.0 Release - New dcc.Graph features, updated dcc.Link, React upgrade and bug fixes - #9 by ivaylo
- 📣 Dash v1.9.0 release - Bug fixes
- 📣 Dash v1.8.0 release - dcc.Graph updates, markdown & link support in DataTable, and more - #17 by Jialun
- 📣 Dash v1.7.0 released - Async component fixes, inline clientside callbacks, and bug fixes - #15 by Marc-Andre
- 📣 Dash 1.6.0 released - dcc.Graph updates, async performance improvements, improved caching - #5 by mbkupfer
Feedback, questions, thoughts? Let us know how it goes!