📣 Initial release of Dash Deck, a library for rendering webgl & 3D maps with pydeck and deck.gl in Dash

Today, we are releasing the initial version of Dash Deck, a library for building 3D interactive maps and graphical visualizations directly in Dash. Built on top of deck.gl, it offers seamless support for maps built with pydeck, and also support deck.gl’s JSON API (which you can try out here).

If you want to directly dive into the demos and the code, check out this Dash Deck Explorer, which will look like this:

You can also check our the source code in the Github repository. It also contains an extensive Readme to help you get started, as well as tips & tricks for more advanced Dash Deck use cases.


If you haven’t used pydeck before, you can check out the Getting Started section. In essence, it ports deck.gl into Jupyter, allowing you to create maps like the ones in the explorer shown above.

First, you need to ensure that your environment variable MAPBOX_ACCESS_TOKEN is a valid environment variable (more details in the Readme). Then, you can install pydeck like this:

pip install pydeck

Inside a notebook, you can build a 3D interactive map with pydeck using the following code (borrowed from the official docs):

import os
import pydeck as pdk

mapbox_api_token = os.getenv("MAPBOX_ACCESS_TOKEN")

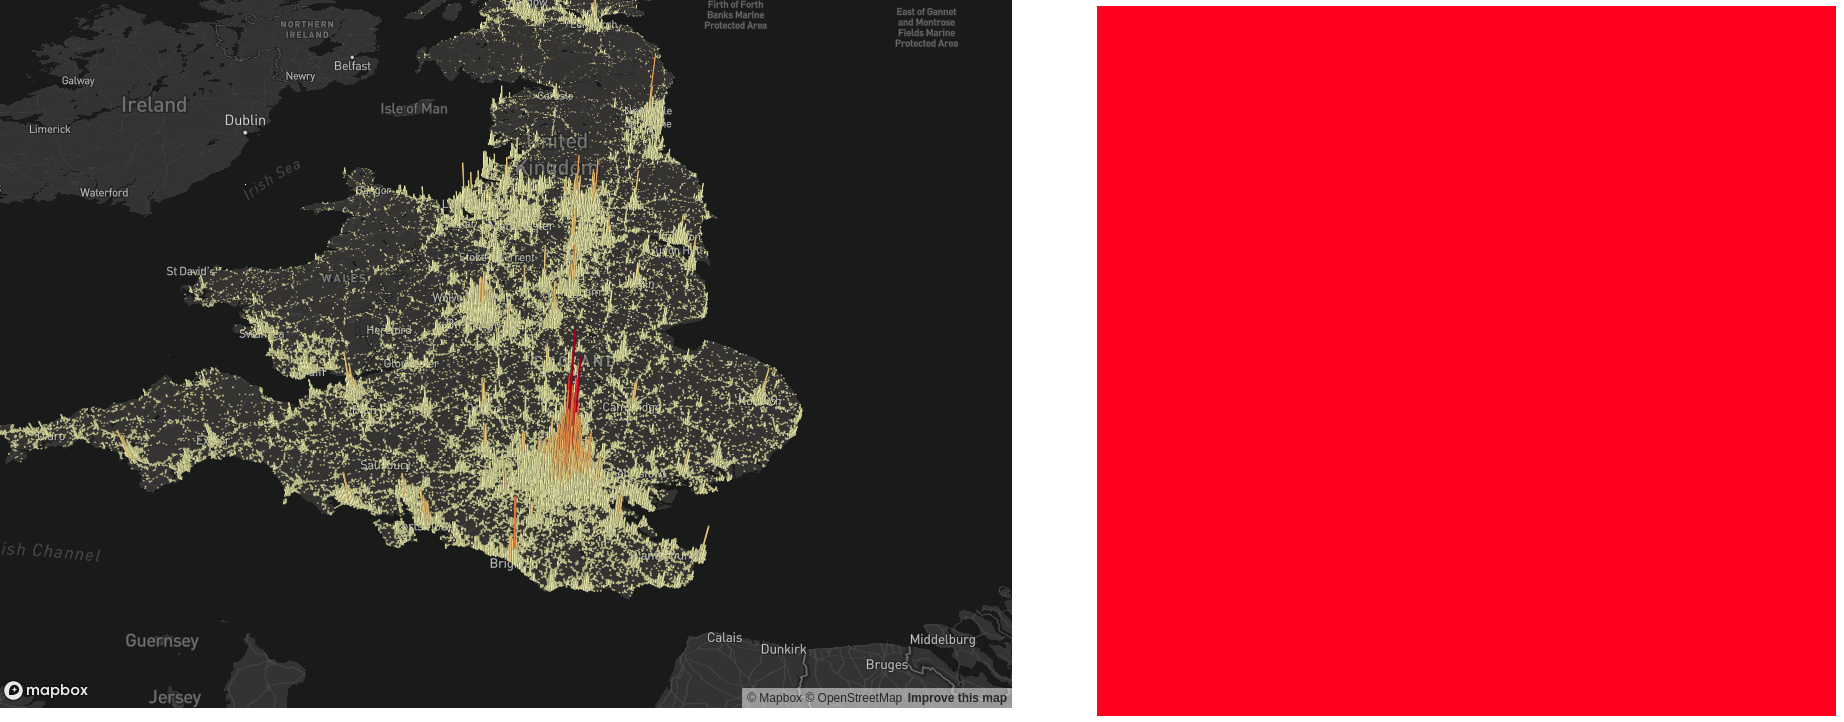
# 2014 locations of car accidents in the UK
UK_ACCIDENTS_DATA = ('https://raw.githubusercontent.com/uber-common/'
                     'deck.gl-data/master/examples/3d-heatmap/heatmap-data.csv')

# Define a layer to display on a map
layer = pdk.Layer(
    'HexagonLayer',
    UK_ACCIDENTS_DATA,
    get_position=['lng', 'lat'],
    auto_highlight=True,
    elevation_scale=50,
    pickable=True,
    elevation_range=[0, 3000],
    extruded=True,                 
    coverage=1)

# Set the viewport location
view_state = pdk.ViewState(
    longitude=-1.415,
    latitude=52.2323,
    zoom=6,
    min_zoom=5,
    max_zoom=15,
    pitch=40.5,
    bearing=-27.36)

# Render
r = pdk.Deck(layers=[layer], initial_view_state=view_state, mapbox_key=mapbox_api_token)
r.to_html('demo.html')

and you will get a map similar to what is shown in this demo.

If you want to use it in Dash, you need to first install the library:

pip install dash-deck

Then, create the component:

import dash_deck
deck_component = dash_deck.DeckGL(
    r.to_json(), id="deck-gl", tooltip=True, mapboxKey=r.mapbox_key
)

Now, you can directly use this deck_component inside your Dash app, and interact with it using callbacks!


This initial version (v0.0.1) already contains 28 demos, mostly ported from Pydeck. They can handle many complex scenarios, including beta-features like lighting and globe views. Nonetheless, the API is still at an early stage and it has not been extensively integrated in the Dash ecosystem. If you find any bugs, would like to add new features, or contribute a new demo, feel free to open an issue! From there, we would be happy to work with you to fix them and provide a better experience for the Dash community.

For any feedback, suggestion, ideas, feel free to share them in this thread. We are happy to know what you are planning to build with the library, and don’t forget to share what you’ve made with Dash Deck in the #show-and-tell thread!

13 Likes

Hi, I am trying to merge a deck compoment into a dcc.Graph, but I get an error. Is it possible?

mapa_movilidad = dash_deck.DeckGL(
r.to_json(),
id=“deck-gl”,
mapboxKey=r.mapbox_key
)

html.Div(
id=“graph-container”,
children=dcc.Loading(
className=“graph-wrapper”,
children=dcc.Graph(id=“graph-mov”, figure=mapa_movilidad),
style={“display”: “default”},
),
),

Hi! dash_deck.DeckGL is a stand-alone component that is not related to dcc.Graph. I’d recommend to directly feed it as a children of html.Div:

mapa_movilidad = dash_deck.DeckGL(
r.to_json(),
id=“deck-gl”,
mapboxKey=r.mapbox_key
)

html.Div(
id=“graph-container”,
children=dcc.Loading(
className=“graph-wrapper”,
children=mapa_movilidad
style={“display”: “default”},
),
),

Hi xhlu,
I have some questions about applying dash_deck for building dashboards

If i want to set pydeck_graphs into a container, what kind of css would be fit for it.


for example, the pic above, i want my dash-deck graph fit in a proper container.

I have tried some css styles but they all ended as covering up everything. Below is the code and outcome. (its copied from dash gallary: https://github.com/plotly/dash-sample-apps/tree/master/apps/dash-oil-and-gas)

html.Div(
[
html.Div(
id=“deck_component”,
children=dcc.Loading(
className=“pretty_container five columns”,
children=deck_component,
style={“display”: “default”},
))

Please let me know what shall I do, what shall I read.

I really like this powerful plugin, its broderning the boundaries of Dash.

Sincerely,
Kris.

Hi Kris,

Thanks for raising this issue! It is indeed a pretty difficult one.

Behind the scene, Dash Deck passes a style prop to deck.gl, and lets it handle it. This means that you can directly modify the CSS style of the component itself, as shown in this example.

You will find that we define the component in the following way:

        dash_deck.DeckGL(
            r.to_json(),
            id="deck-gl",
            tooltip=True,
            mapboxKey=r.mapbox_key,
            style={"width": "55vw", "height": "75vh"},
        )

Which will look like this:

Now, what if you want to style a html.Div, where one of the children is this component? Here’s the logical way to do this:

        html.Div(
            dash_deck.DeckGL(
                r.to_json(),
                id="deck-gl",
                tooltip=True,
                mapboxKey=r.mapbox_key
            ),
            style={
                'width': '55vw',
                'height': '75vh',
                'display': 'inline'
            }
        )

note I’m adding inline display since html Div would usually be a block display

You will notice that the style was not correctly passed to the child component:

One way is to set the style of Deck GL to inherit the style of its parent:

        html.Div(
            dash_deck.DeckGL(
                r.to_json(),
                id="deck-gl",
                tooltip=True,
                mapboxKey=r.mapbox_key,
                style={'height': 'inherit', 'width': 'inherit'}
            ),
            style={
                'width': '55vw',
                'height': '75vh',
                'display': 'inline'
            }
        )

careful! only inherit the ones you need, don’t do “all”: “inherit” since it might cause problems

Ok, now it shows up correctly:

This will also work with CSS classes. For example, if you define this class in your assets/styles.css:

.superCoolClass {
    width: 55vw;
    height: 75vh;
    display: inline;
}

And assign that class to the parent div:

        html.Div(
            dash_deck.DeckGL(
                r.to_json(),
                id="deck-gl",
                tooltip=True,
                mapboxKey=r.mapbox_key,
                style={'height': 'inherit', 'width': 'inherit'}
            ),
            className='superCoolClass'
        )

You will get the exact same result.


Hope this helps! I am not very familiar with the oil and gas demo, so I went with this example since it’s easier to reproduce and more generic.

3 Likes

Returned to leave a thank message!

It worked! Now all know dash+dash_deck can achieve my exact goal,the only way for me to go from here is up.

I will definately share this with my friends.

2 Likes

@xhlu When I use your example, everything works fine. But if I download the UK_ACCIDENTS_DATA csv:

UK_ACCIDENTS_DATA = ('https://raw.githubusercontent.com/uber-common/'
                     'deck.gl-data/master/examples/3d-heatmap/heatmap-data.csv')
s=requests.get(UK_ACCIDENTS_DATA).content
c=pd.read_csv(io.StringIO(s.decode('utf-8')))

layer = pdk.Layer(
    'HexagonLayer',
    c,
    get_position=['lng', 'lat'],
    auto_highlight=True,
    elevation_scale=50,
    pickable=True,
    elevation_range=[0, 3000],
    extruded=True,
    coverage=1)

I get the following React Error in the console:

Warning: Cannot update a component from inside the function body of a different component.
    in n (created by CheckedComponent)
    in CheckedComponent (created by BaseTreeContainer)
    in ComponentErrorBoundary (created by BaseTreeContainer)
    in BaseTreeContainer (created by Context.Consumer)
    in Unknown (created by BaseTreeContainer)
    in div (created by u)
    in u (created by CheckedComponent)
    in CheckedComponent (created by BaseTreeContainer)
    in ComponentErrorBoundary (created by BaseTreeContainer)
    in BaseTreeContainer (created by Context.Consumer)
    in Unknown (created by UnconnectedContainer)
    in div (created by UnconnectedGlobalErrorContainer)
    in div (created by GlobalErrorOverlay)
    in div (created by GlobalErrorOverlay)
    in GlobalErrorOverlay (created by DebugMenu)
    in div (created by DebugMenu)
    in DebugMenu (created by UnconnectedGlobalErrorContainer)
    in div (created by UnconnectedGlobalErrorContainer)
    in UnconnectedGlobalErrorContainer (created by withRadiumContexts(UnconnectedGlobalErrorContainer))
    in withRadiumContexts(UnconnectedGlobalErrorContainer) (created by ConnectFunction)
    in ConnectFunction (created by UnconnectedContainer)
    in UnconnectedContainer (created by ConnectFunction)
    in ConnectFunction (created by UnconnectedAppContainer)
    in UnconnectedAppContainer (created by ConnectFunction)
    in ConnectFunction (created by AppProvider)
    in Provider (created by AppProvider)
    in AppProvider

Note that I did this exercise because I was originally trying to do it with another DataFrame, and I was getting this error, so I tried reproducing it with your example

Any idea what’s happening?

This is weird. I’ve used pydeck and Dash-deck with various dataframes and it worked well.

Have you tried:

  • pd.read_csv(url) instead of pd.read_csv(io.StringIO(s.decode('utf-8')))?
  • run this example inside a notebook with pydeck? Code is here.
  • c.head() and compare that with the actual CSV to see if it looks the same?

I had tried your first and third point before answering your post. I’ll try to do it on pydeck and let you know. thanks!

Coming back to make posts, this library is good and has its high potential use of ‘Smart Cities’ stuff.

hope ppl will find this library and support you guys.

1 Like

Thanks @xhlu

I have just worked through the night exploring dash-deck, coding like a madman. This is so cool.

I have a question for you regarding custom tooltips for dash-deck:

can you get custom data for the tooltip as json “properties.blah” for a pydeck GeoJsonLayer??

I’ve managed to get custom tooltip data from a dataframe in a different example in the Globeview as per the example:

tooltip={“text”: “{name}, {primary_fuel} plant, {capacity_mw}MW, {country_long}”}

Where the templated values are columns in the dataframe. But in another example I’m working on which is a PolygonLayer and GeoJsonLayer (essentially the “GeoJsonLayer” demo), I haven’t been able to use a dataframe. So I’m using a feature collection of json polygons and I have custom data in this feature collection, that I want to extract, something like:

tooltip={“text”: “{properties.pop_est}”}

I’ve tried no-end of combinations, studied the pydeck tooltip and your readme, but I just can’t get it to work. If I simply set:

tooltip=True

I definitely get data and I can see all the feature properties I want to access. I’m totally new to pydeck and I know this is a 0.0.1 release so not sure if it is a known issue. If there is another way (such as using a dataframe instead of a geojson feature collection, please let me know). Screenshot attached.

Also FYI, if anyone wants to see a public live demo, I’ve got 80 different datasets running using the Geojsonlayer dash-deck so you can explore how it looks. Quite fun flying around etc.

www.worldatlas2.org (JIGSAW button once you’ve loaded a dataset)

Thanks
Dan

2 Likes

Hi Dan! Super happy to hear you enjoy using the library! Your graph looks amazing btw :slight_smile:

The tooltip mechanism is a feature that was added by pydeck, and in dash-deck we are directly copying the makeTooltip utility function that they implemented.

If you take a look at the source code of widgetTooltip.js for pydeck, they are replacing the values in the template with the exact object key, so something like properties.pop_est will not work since it’s not a key of the data object you are passing to tooltip. If you think that’s something that’d be interesting to add to pydeck, feel free to make an issue on their repo and add a pydeck tag.


One workaround I’d suggest would be to flatten your object if that’s possible. For example, if your data is a python dictionary that looks like this:

data = {
  "name": ...,
  "primary_fuel": ...,
  "properties": {
    "pop_est": ...,
    ...
  }
}

then, before feeding it to pydeck, you can modify it to be:

data = {
  "name": ...,
  "primary_fuel": ...,
  "properties_pop_est": ...,
  "properties_...": ...,
  "..."
}

then you would pass that directly to tooltip:

tooltip={“text”: “{properties_pop_est}”}

Let me know if that works!

1 Like

@xhlu… you are my hero :smiley:

Thank you so much. Your work-around has done the trick!

I now have a custom multi-value tooltip for a Geojson polygon extrusion! I haven’t dared look into formatting but you know, I can live without d3 level number formatting for now.

To any others that want to try this kind of chart (pydeck polygon layer, pydeck geojson layer) I can share a few workarounds I’ve done to get it working using a json feature collection (with geometry) and no dataframe input.

Colouring individual features with dash-deck “GeoJsonLayer”
This has a few quirky parse issues. I got it working trial and error to colour individual features, with some pain. I’ll quickly explain.

First, from the dash deck demo, this looks like:

geojson = pydeck.Layer(
“GeoJsonLayer”,
DATA_URL,
opacity=0.8,
stroked=False,
filled=True,
extruded=True,
wireframe=True,
get_elevation=“properties.valuePerSqm / 20”,
get_fill_color=“[255, 255, properties.growth * 255]”,
get_line_color=[255, 255, 255],
)

The get_fill_color is what you want. Now you can set the RGB values manually to something like:

get_fill_color=[255, 255, 255]

But of course this will colour ALL your features the same. If you want to distinguish them, if you look at the example, it’s actually all in text, with a json property in there, indicating you can manipulate the RGB values for the parser.

get_fill_color=“[255, 255, properties.growth * 255]”

Note this is a string. In the case of the dash deck demo (above) this does work, and the properties.growth value is parsed for every feature, but in every case it pushes the 255 value up out of range, which results in the actual colour output [255,255,0] actually displayed. Now at this point you might think (as I did): sweet as, I’ll just construct a nicely formatted string of RGB values as a custom property for each feature. i.e.

in the feature collection: properties.color = “[123,123,123]”

in the pydeck layer def: get_fill_color=“properties.color”

Didn’t work. I then tried returning an invidual string for each RGB in the string hoping it would be parsed like:

get_fill_color=“[properties.red, properties.green, properties.blue]”

I was sure this would work. It didn’t. The parser is particular and YOU MUST multiply each json feature property value by a number inside the string. So I solved it with this:

get_fill_color=“[properties.red*1, properties.green*1, properties.blue*1]”

Tooltip
Just to share how I got this working with help from @xhlu. Yes all you need to do is add new key/value pairs to your geojson feature collection at the feature level. i.e pull any properties key/values you need up one level.

for i in range(0, len(gj[‘features’])):
gj[‘features’][i][‘my-new-key’] = blah

Then you can reference the keys directly in the DeckGL initialisation code block, and this should magically work for all your features by returning the associated value for that key :slight_smile:

dash_deck.DeckGL(r.to_json(),
id=“deck-gl”,
mapboxKey=r.mapbox_key,
#style={“background-color”: ‘#b0dff7’},
#tooltip=True,
tooltip={“text”: “{my-new-key}” },
)

Cheers
Dan

3 Likes

That looks amazing! It’s a really neat idea to leverage the 3D capabilities of deck.gl to building such “geo-bar charts” :open_mouth:

I think the Dash community would love it if you share it as a Show & Tell post. Source code and hosted demo (e.g. on Dash Enterprise or Heroku) would be appreciated!

1 Like

Already there @xhlu, here! (with link to publicly hosted site!)

I’ll keep the community updated on that thread as I progress with further implementation.

You can run the graphs live and explore 80 datasets. Using Gunicorn as WSGI HTTP server and I’ve spun it up on Heroku using a couple of 2-x dynos. Seems to be holding up so far.

Would love feedback, thoughts, ideas. Much more on the way!

Dan.

2 Likes

I completely missed the post, thank you for sharing there! There’s so many things to do in the app, I have yet to fully explore it!

Have you thought of sharing it on reddit.com/r/dataisbeautiful? I think they would love it over there :slight_smile:

1 Like

Thanks @xhlu . Yes I think that is a great idea on the subreddit (I’m on it but have never posted). I’ve been working hard to get a few more things implemented, and then I think I will do it!

Choropleth geo-bar-graph now live

Hot off the press. With extreme pain, I’ve managed to turn the geo-bar-graph into a choropleth aswell based on the selected colorwheel style from the underlying choroplethmapbox plotly graph object. I had to scrape a colour array from the map state, and implement my own linear color interpolation algorithm. It’s just about killed me but I think it’s working ‘well enough’.

You can change the colour scheme in settings to try out different ones!
WORLD ATLAS 2.0 (14)

1 Like

@xhlu @chriddyp

Guys I’ve managed to get the experimental globe view running as a 3d choropleth map!

This mimics the colorwheel palette of the main choropleth_mapbox graph object. I’ve built a custom linear colour interpolation algorithm based on a colour array I can extract from the graph object figure state. Got it working for any dataset, with hover data!

Still have a few json issues with Americas, but it’s about 95% there :slight_smile:

WORLD ATLAS 2.0 (19)

WORLD ATLAS 2.0 (18)

3 Likes

That looks amazing, I think that’d make a neat add-on library to go along dash-deck!

1 Like