Update: version 4.14 was released since this was posted.
I’m happy to announce that Plotly.py 4.13 is now available for download via pip and conda! For up-to-date installation and upgrading instructions (including the extra required steps for JupyterLab!) please see our Getting Started documentation page and if you run into trouble, check out our Troubleshooting Guide.
 What’s new in Plotly.py 4.13
Our changelog has details and links to individual pull requests, but here are the highlights:
 Deep Magic Underscore Error Messages
In v3.0 we introduced lengthy and informative error messages when updating figures using dot-notation like fig.layout.legend.font.famly="Arial" (notice the typo in famly) and in v4.0 we introduced “magic underscores” which are a way of updating deeply-nested props in a single chainable function call like fig.update_layout(legend_font_famly="Arial"). Until today, however, the latter didn’t produce as helpful an error message as the former: it would tell you “legend_font_famly isn’t a child of layout” instead of trying to help you fix the spelling of family.
We know that lots of people rely on these error message to learn about the deep and complete hierarchy of figure attributes (no need to be embarrassed, we do too!), so this gap made magic underscores significantly less useful for everyone. In version 4.13 we introduce “deep magic underscore error messages” and they’re pretty magical indeed! ![]()
Check it out, the error message now traverse the legend_font_famly down to font and tells you famly is invalid, and it even helpfully suggests that family might be what you’re looking for! At the bottom it highlights the offending portion of the offending string.
ValueError: Invalid property specified for object of type plotly.graph_objs.layout.legend.Font: 'famly'

Did you mean "family"?

    Valid properties:
        color

        family
            HTML font family - the typeface that will be applied by
            the web browser. The web browser will only be able to
            apply a font if it is available on the system which it
            operates. Provide multiple font families, separated by
            commas, to indicate the preference in which to apply
            fonts if they aren't available on the system. The Chart
            Studio Cloud (at https://chart-studio.plotly.com or on-
            premise) generates images on a server, where only a
            select number of fonts are installed and supported.
            These include "Arial", "Balto", "Courier New", "Droid
            Sans",, "Droid Serif", "Droid Sans Mono", "Gravitas
            One", "Old Standard TT", "Open Sans", "Overpass", "PT
            Sans Narrow", "Raleway", "Times New Roman".
        size


Did you mean "family"?

Bad property path:
legend_font_famly
            ^^^^^
 Magic Underscores in Documentation
In the same vein as the work on error messages above, we’ve upgraded our Figure Reference pages to include copy-pasteable fig.update_*(...) lines of code to let you more quickly modify your figures using magic underscores. ![]()
These snippets automatically display the appropriate update method (e.g.fig.update_traces() or fig.update_layout() or fig.update_xaxes()) and prepopulate the magic underscore keyword argument for you (e.g. legend_font_family).
Check out this screenshot from our layout reference page for example:

Remember that our documentation search system (available on every documentation page at the top of the left-hand sidebar) automatically searches through every attribute in the reference documentation for you, to help you get to this code as fast as possible.
 Performance Improvements (especially for Dash!)
When displaying figures anywhere, be it in a notebook, with Kaleido or in a Dash app, Plotly.py always goes through a JSON encoding step which transforms the Figure object into structured JSON text. Of special note here is that the output of every Dash callback goes through the same encoding code, meaning that any performance improvements in this area benefits literally every Dash callback. And improve it we did!
In v4.13, most figures and most Dash callbacks will be encoded to JSON more than twice as fast! These gains will be felt the most for large figures such as heatmaps with many elements, but any callback whose JSON representation doesn’t include the strings Infinity or Nan will benefit from these improvements. This means you can make your Dash app snappier (as well as your static image exports and interactive vis sessions) just by upgrading your version of plotly to 4.13.
 Faceted Maps in Plotly Express
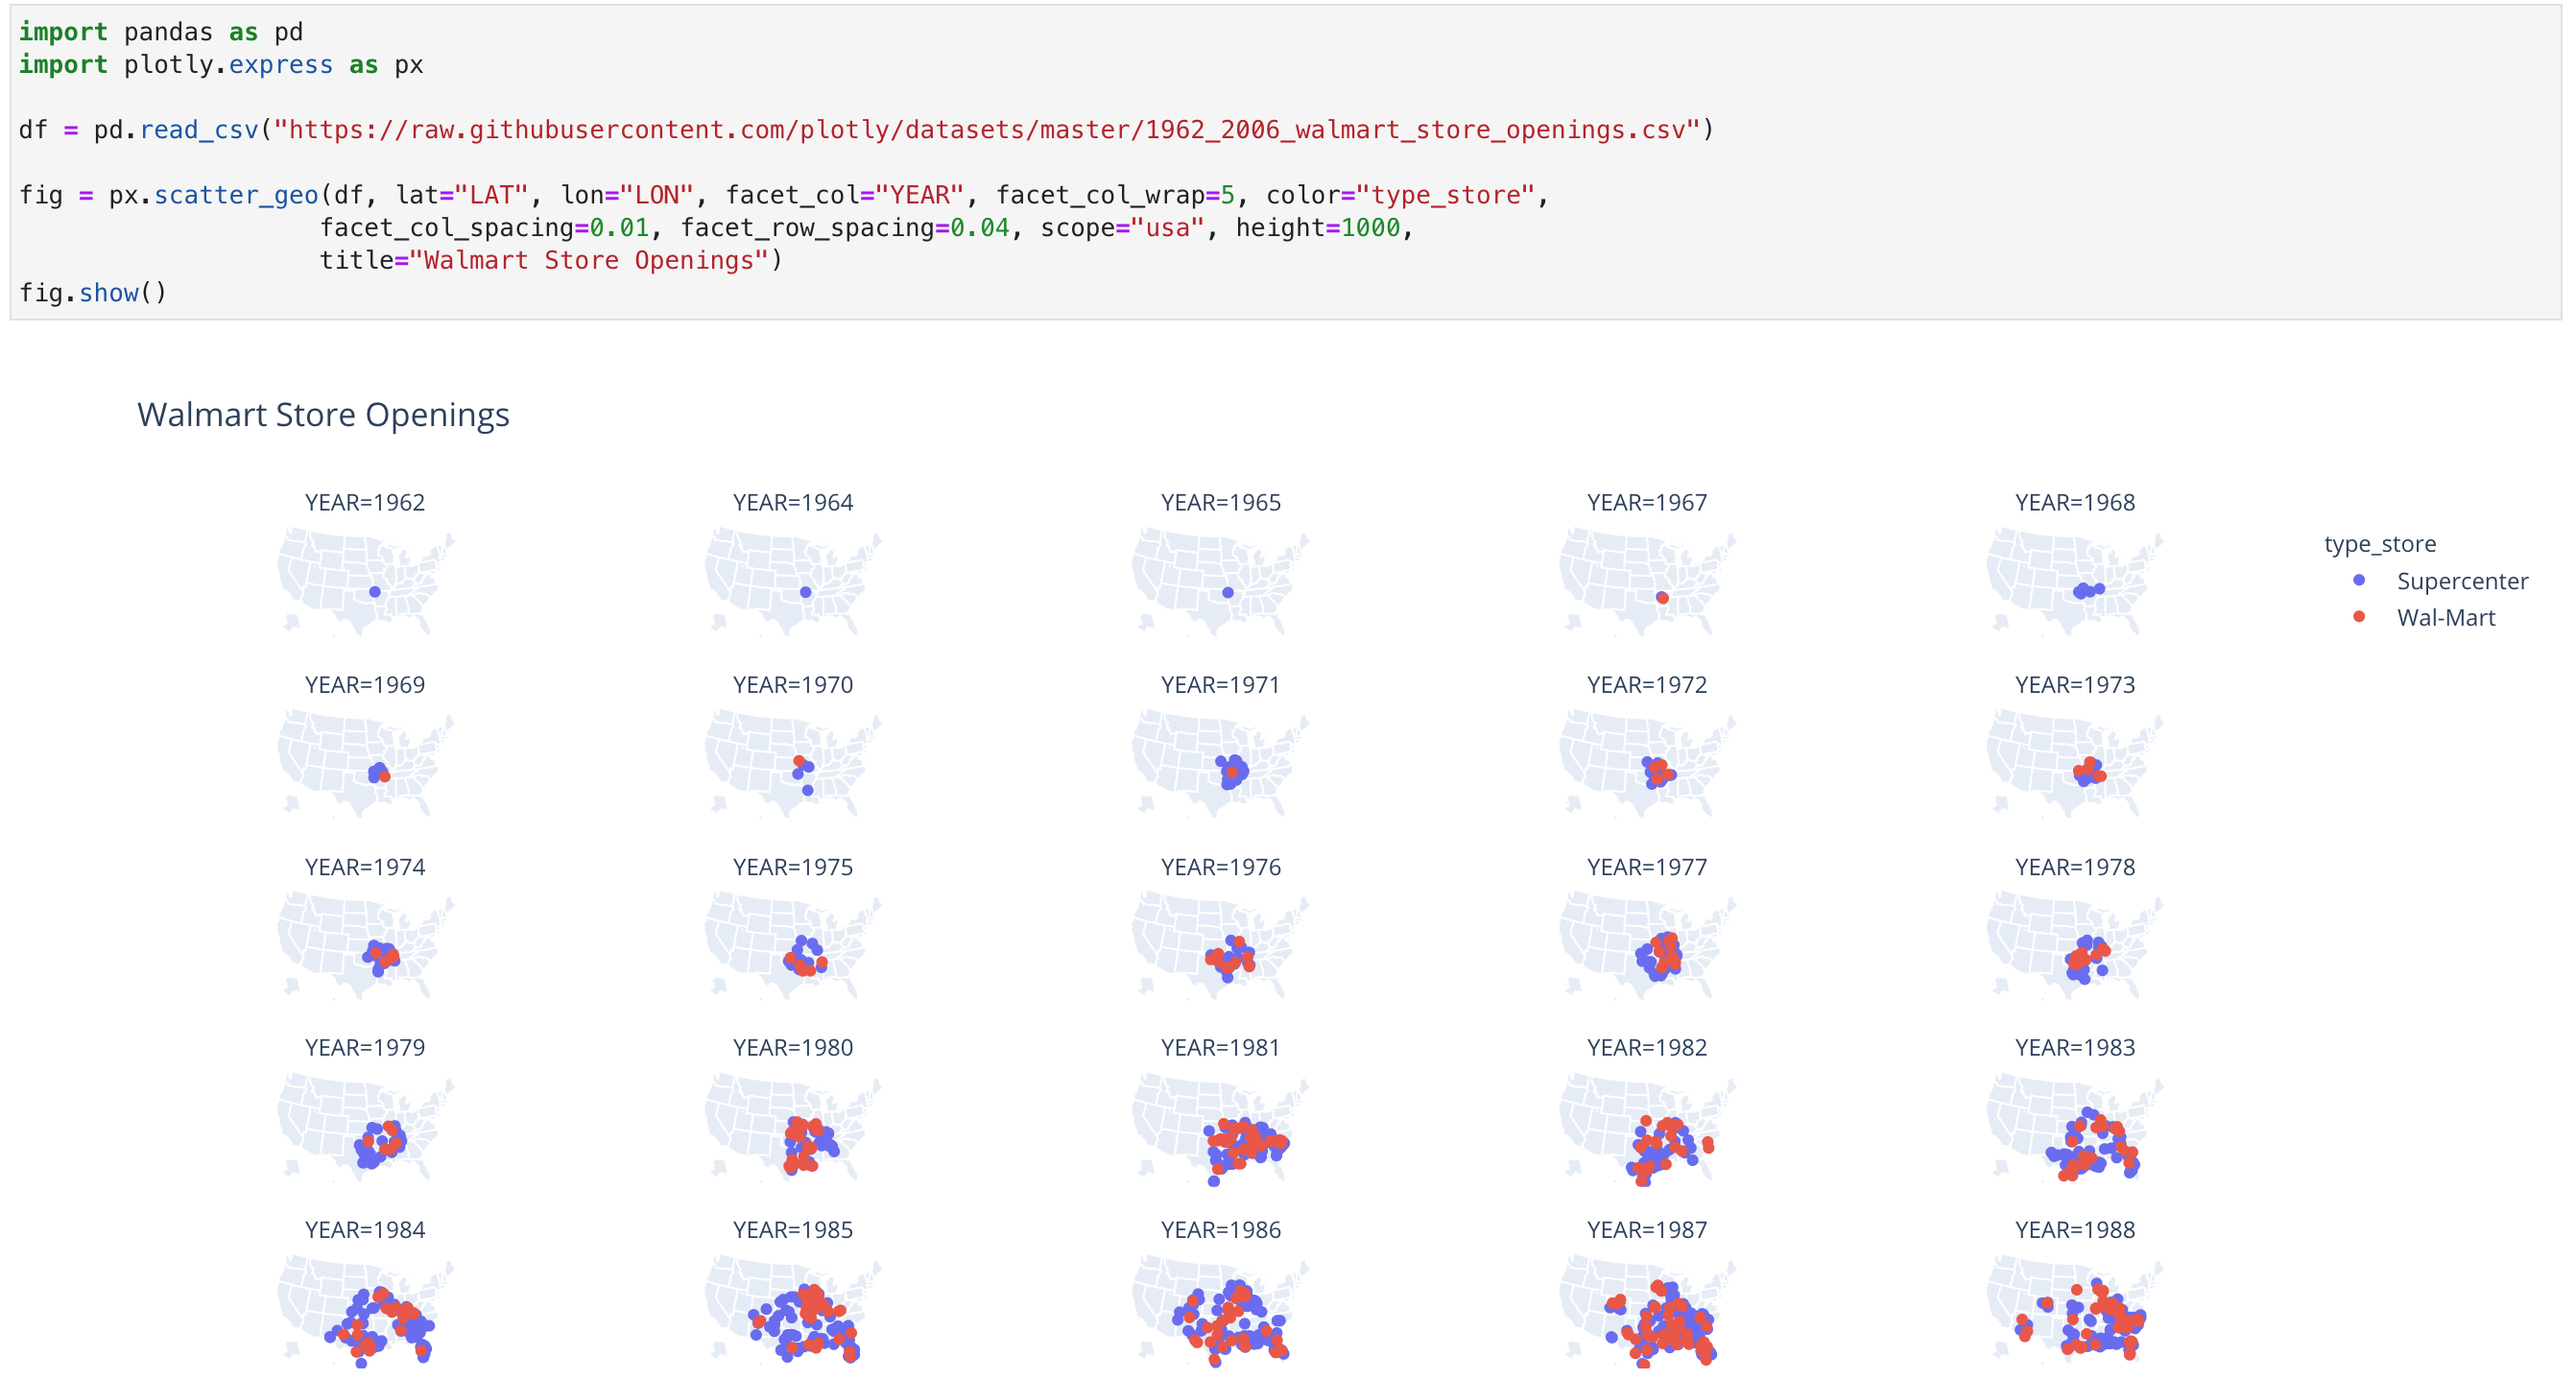
At Plotly, we consider documentation, error messages and performance to be just as important as totally new features, which is why I put those first in this announcement, but hey, we like adding new features too! In v4.13 the Plotly Express functions for outline maps (px.choropleth, px.scatter_geo and px.line_geo) have all been upgraded to support faceting, meaning that you can now make maps like these in just a single PX function call:

 Powered by Plotly.js 1.57 and perfect for Dash 1.17
The version of Plotly.js that Plotly.py 4.13 is built on is the same one that’s bundled with the recently-released Dash 1.17 so we recommend that if you’re a Dash user you upgrade to both Dash 1.17 and Plotly.py 4.13 to get the full benefit of all of these libraries working together, especially the new performance improvements.
 Get it now!
To sum up: Plotly.py 4.13 is out and if you’re excited about any of the above features, head on over to our Getting Started documentation page for full installation instructions, and don’t forget to upgrade your JupyterLab extensions if that is your environment of choice!
 In Case You Missed It: Previous 4.x Announcements
- Plotly.py 4.12:
- Horizontal and vertical lines and rectangles
- Plotly.py 4.11:
- Period positioning on
dateaxes
- Period positioning on
- Plotly.py 4.10:
date-axis andpx.timeline()improvements- Full Figures for Development
- A Faster
px.imshow()
- Plotly.py 4.9:
- Kaleido for static image export
- Hexbin Tile Maps
- Timelines
- Plotly.py 4.8:
- Plotly Express Support for Wide- and Mixed-Form Data
- a Pandas backend
- Plotly.py 4.7:
- Major performance improvments
- Shape-drawing
- Plotly.py 4.6:
- unified hover labels
- excluding weekends from time-series axes
imshowlabelling andxarraysupport
- Plotly.py 4.5:
- legend titles
- GeoJSON choropleth improvements
- a new sunburst/treemap
pathAPI uniformtext
- Plotly.py 4.4:
- new Plotly Express functions for pie charts, sunbursts, treemaps, funnels maps,
- Plotly.py 4.3:
px.imshowfor heatmaps and full-color images- facet wrapping in Plotly Express,
- Plotly.py 4.2:
- Treemaps
- Plotly Express input enhancements to work without data frames
texttemplateeverywhere
- Plotly.py 4.1:
- Mapbox maps without Mapbox tokens
- Choropleth and Density mapbox maps
- Indicators (big numbers, gauges, bullet charts)
- Plotly.py 4.0 :
- offline-only
plotly.express-first- displayable anywhere