Update: version 4.9 has been released since this was posted.
I’m excited to announce that as of this morning, Plotly.py 4.3 is available for download via pip and conda! For up-to-date installation instructions (including the extra required steps for JupyterLab!) please see our Getting Started documentation page.
What’s new in Plotly.py 4.3
Our changelog has lots of play by play, but here are the highlights:
Images
A new graph_objects.Image trace type, and a corresponding new plotly.express.imshow() function that makes it really easy to use. You can now explore multichannel image data in interactive charts, for applications such as satellite imaging, medical imaging, quality inspection, building training sets for machine learning models, etc.
A simple white template
A new community-contributed simple_white template for those who like a more classic look on their figures. A big “thank you” to Joel Ostblom for this contribution, and all the other pull requests that went along with it!
Facet Wrapping in Plotly Express
A new argument for Plotly Express methods for facet wrapping: facet_col_wrap.
API Reference Documentation
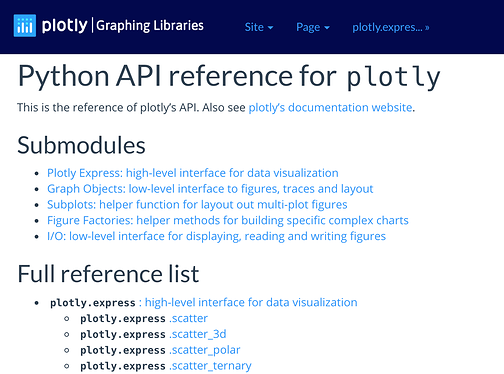
New, automatically-generated API reference documentation for Plotly.py, for all your docstring-lookup needs.
Binder Links in Docs
All the documentation pages under Plotly Python Graphing Library have a little “launch binder” link in the top right corner so you can interactively play with whatever’s on the page, without installing or copy-pasting anything.
On that note, right next to that button is a handy “Edit this page on Github” link you can follow to easily contribute documentation fixes or suggestions if you find that anything is wrong or unclear.
Getting Help
A new troubleshooting guide, where we will accumulate all our hard-won lessons about how to get things working right.
What was new in Plotly.py 4.2
I’m a bit embarrassed to add here that we never formally announced Plotly.py versions 4.2 or 4.1, even though many of the new features from those releases were announced in passing in the corresponding Dash release announcements! So without further ado, here is the changelog and list of what’s new in 4.2, which was released just 27 days ago:
Treemaps & Sunbursts
A new graph_objects.Treemap trace type, which works a lot like graph_objects.Sunburst.
Along the way, sunburst charts gained the ability to be colored via a continuous variable.
Plotly Express Input Enhancements
Plotly Express now accepts input data in many more formats than single data frames.
Plotly Express methods now accepts custom_data, so you can now easily use these methods for interactive figures in Dash. Here’s a 30-line app showing how selections in one Plotly Express figure can be reflected in another.
Animated Bar Chart Transitions
Bar charts now support animated transitions. This means you can get smooth bar animations in Plotly Express and you can use the layout.transition attribute to get smooth transitions in Dash as well. We’ve updated the Basic Dash Callbacks documentation to show how to use this attribute.
Text and Hover Templates
All trace types now support texttemplate as well as hovertemplate. These are alternatives to textinfo/hoverinfo which makes it much easier to control the formatting of on-figure/in-hoverlabel text without string manipulation or storing a ton of extra data in the figure. See the texttemplate docs and hovertemplate docs for details.
Add/Update/For-Each Enhancements
New add/update/for-each methods on the main Figure object for annotations, shapes and images.
A new overwrite argument to all Figure.update methods for when you don’t want to merge your changes into the existing figure.
What was new in Plotly.py 4.1
We released 4.1 in early August, and here’s the changelog and highlight reel:
Mapbox Maps Without Mapbox Tokens
You can now make tile-maps without needing a Mapbox token! This means you can use data from any public or private tile server. The trace types that have “mapbox” in the name use an open-source library from the company named Mapbox, but this doesn’t mean you have to get your tiles from them. In this screenshot, the base map is from a public US Geological Survey server and the weather data is from a different type of public Environment Canada server, no tokens required!
Mapbox Choropleth Maps
A new go.Choroplethmapbox trace type to easily build interactive choropleth maps on a tile-map, starting from a GeoJSON file.
Mapbox Density Maps
A new go.Densitymapbox trace type for when you want to aggregate multiple data points into a smooth visual representation on top of a tile map.
Indicators: Big Numbers, Gauges and Bullet Charts
A new, highly flexible trace type go.Indicator for all your big-number, gauge-meter and bullet-charting needs: ideal for Dash dashboards!
Get it now!
Plotly.py 4.3 is out and if you’re excited about any of the above features, head on over to our Getting Started documentation page for full installation instructions!


