Update: version 4.9 has been released since this was posted.
I’m pleased to announce that Plotly.py 4.8 is now available for download via pip and conda! For up-to-date installation instructions (including the extra required steps for JupyterLab!) please see our Getting Started documentation page and if you run into trouble, check out our Troubleshooting Guide.
 What’s new in Plotly.py 4.8
Our changelog has details and links to individual pull requests, but here are the highlights:
 Plotly Express Support for Wide- and Mixed-Form Data
The big news is that with this version, if the data you’re trying to plot isn’t in long-form or “tidy” format, you no longer have to wrangle it into that shape for plotting: Plotly Express now accepts wide-form or even “messy” mixed-form data for 2D-Cartesian plots! This includes scatter, line, area, bar, histogram, violin, box, strip, funnel, density_heatmap and density_contour. This is a capability that users of Dash and Plotly Express and our Dash Enterprise customers have been asking for pretty consistently ever since Plotly Express came out last year with “tidy”-only support. Today I’m proud to say we were able to find a way to implement this in Plotly Express in a way which doesn’t involve all that much new code, and which remains coherent and backwards-compatible with the rest of the API. Most importantly, these new capabilities dramatically expand the domain of cases where you can visualize your data in a single line of Python, now without needing to wrangle your data first!
As a bit of context around the terminology, there are three common conventions for storing column-oriented data, usually in a data frame with column names:
- long-form data has one row per observation, and one column per variable. This is suitable for storing and displaying multivariate data i.e. with dimension greater than 2. This format is sometimes called “tidy”.
- wide-form data has one row per value of one of the first variable, and one column per value of the second variable. This is suitable for storing and displaying 2-dimensional data.
- mixed-form data is a hybrid of long-form and wide-form data, with one row per value of one variable, and some columns representing values of another, and some columns representing more variables.
Plotly Express can now operate natively on all three of these formats, in addition to the support already present for matrix-like data with px.imshow and for GeoJSON-like data with px.choropleth and px.choropleth_mapbox
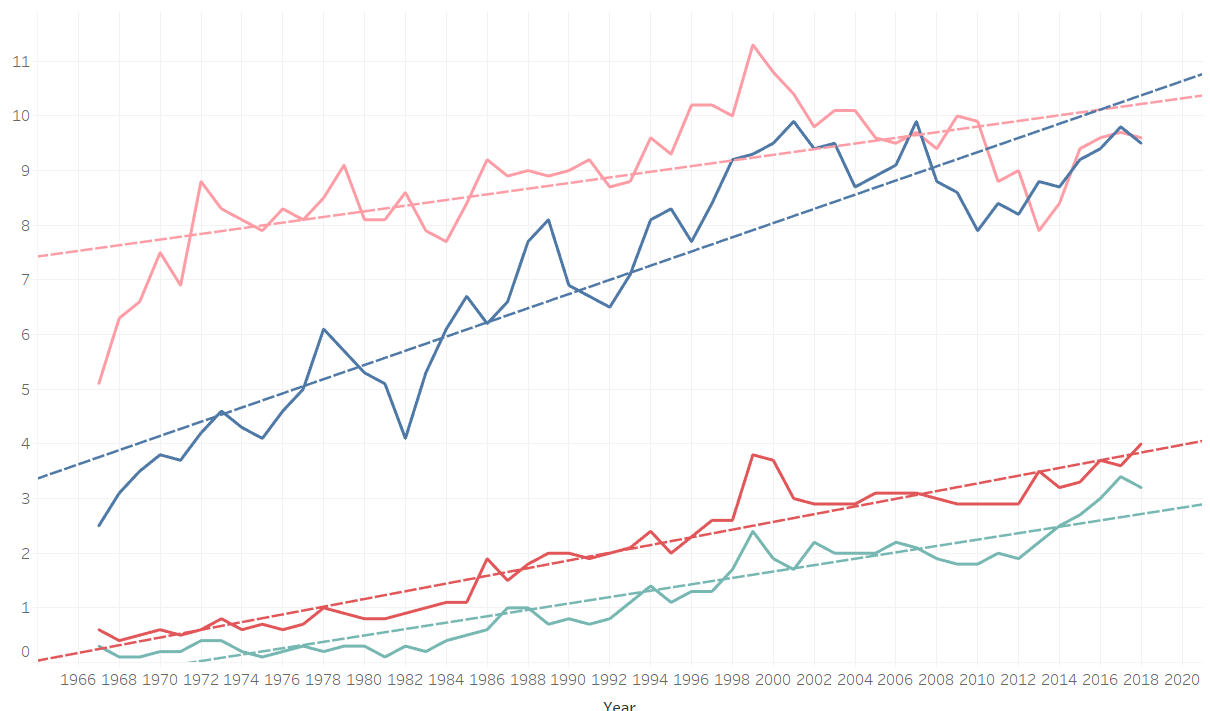
Here’s a side by side example of the same dataset in long-form and wide-form, along with the Pandas functions that will convert back and forth between them. Until today, if you had a wide-form dataset like the one on the left and wanted to plot it using Plotly Express, you would have had to use the Pandas .melt() operation as below to “tidy up” your data first. This is now no longer necessary!

At the API level, the core change we’ve made is that as of now, either x or y (but not both!) can now be specified as a list of column names (or list-like column vectors) for 2D-cartesian functions, in which case Plotly Express will perform the above Pandas .melt() operation internally and plot the result. We’ve also set up the defaults such that if neither x nor y are specified (which used to result in an empty plot), Plotly Express interprets the data as if it was in wide-form, similar to how Pandas’ default .plot() function works. Here’s an example using the wide form of the dataset above (note that the x and y here could be omitted, as these are the default values):

We’ve actually gone further in this direction than Pandas’ default backend: beyond wide-form support to support for mixed-form data by allowing you to pass in a list of column references to y but still color and facet by different columns!

These new features are really flexible and permit a wider range of permutations than I can pack into one forum post, so I encourage everyone who is interested to read the Plotly Express wide-form data documentation page for them to find out more about how they work!
 A Pandas Plotting Backend, Powered by Plotly Express
With the changes above, Plotly Express can now behave a bit more like the default Pandas plotting backend with respect to the x and y parameters of the corresponding functions. In light of this, we are taking advantage of the new pandas.options.plotting.backend option introduced in Pandas v0.25, and offering an official plotly backend for Pandas plotting. This means that you can import Pandas as you usually do, set the plotting backend to "plotly", and when you call df.plot(), Plotly Express is invoked, and a plotly.graph_objects.Figure object is returned, ready to be customized, rendered, or passed into Dash Core Components’ Graph component. Here’s an example:

A note on API compatibility: The Plotly plotting backend for Pandas is not intended to be a drop-in replacement for the default one; it does not implement all or even most of the same keyword arguments, such as
subplots=Trueetc. The Plotly plotting backend for Pandas is a more convenient way to invoke certain Plotly Express functions by chaining a.plot()call without having to import Plotly Express directly. Plotly Express, as of version 4.8 with wide-form data support implements behaviour for thexandykeywords that are very simlar to thematplotlibbackend.
 Smarter Plotly Express Behaviour for
 x, y and orientation Arguments
As part of the implementation work for wide- and mixed-form support, Plotly Express’ defaults got a lot smarter when you specify just the x or y arguments. These changes make it much more pleasant to do data exploration with Plotly Express, by reducing the amount of typing you need to do to iterate towards the chart that will give you the “aha!” you’re looking for.
For example, as of this version when you specify just the x value for an area or bar chart or violin or box plots, orientation is set to "h" automatically by default, and the y value is set to the data frame index by default, including using the index name in axis titles and hover labels (although both of these are overrideable). If both x and y are provided and one of them contains categorical values and the other numerical values, the orientation is set perpendicular to the categorical axis.
In addition, Plotly Express bar charts and histograms are now more symmetrical: if you provide a y value to a histogram that is contains categorical data in string format, and an x value containing numerical data, you will automatically get a horizontal histogram that uses the sum function to aggregate the x values, whereas previously you would have gotten an unreadable plot, and would have had to set these values yourself. The new symmetry between bar charts and histograms is that if you pass the same arguments to px.bar, you will get the same chart but with the individual bar values visible and hoverable. The symmetry holds if you omit the x value: the histogram aggregates by count and the bar chart automatically sets the x value to 1 for all bars.


 A perfect match for Dash 1.12
Plotly Express is not just for data exploration, although it does excel for this use-case! Every Figure object that is returned by a Plotly Express function is ready to be styled and used in a Dash app! This version of Plotly.py works with the same version of Plotly.js as Dash 1.12.
 Get it now!
To sum up: Plotly.py 4.8 is out and if you’re excited about any of the above features, head on over to our Getting Started documentation page for full installation instructions, and don’t forget to upgrade your JupyterLab extensions if that is your environment of choice!
 In Case You Missed It: Previous 4.x Announcements
- Plotly.py 4.7:
- Major performance improvments
- Shape-drawing
- Plotly.py 4.6:
- unified hover labels
- excluding weekends from time-series axes
imshowlabelling andxarraysupport
- Plotly.py 4.5:
- legend titles
- GeoJSON choropleth improvements
- a new sunburst/treemap
pathAPI uniformtext
- Plotly.py 4.4:
- new Plotly Express functions for pie charts, sunbursts, treemaps, funnels maps,
- Plotly.py 4.3:
px.imshowfor heatmaps and full-color images- facet wrapping in Plotly Express,
- Plotly.py 4.2:
- Treemaps
- Plotly Express input enhancements to work without data frames
texttemplateeverywhere
- Plotly.py 4.1:
- Mapbox maps without Mapbox tokens
- Choropleth and Density mapbox maps
- Indicators (big numbers, gauges, bullet charts)
- Plotly.py 4.0 :
- offline-only
plotly.express-first- displayable anywhere