Hi everyone,
I’ve been building a trading system, and one question keeps coming up: does a good result reflect skill, or did I just try enough things to find something that looks good?
I built Hindsight to explore that question through short interactive games using real and simulated market data:
- Noise Hunt: search for a winning trading rule, then decide whether its apparent edge is real.
- Real or Random?: distinguish a real stock chart from a random walk.
- The Star Manager: choose managers using their track records, then see how they perform.
- Portfolio Challenge: allocate across three stocks as historical prices unfold.
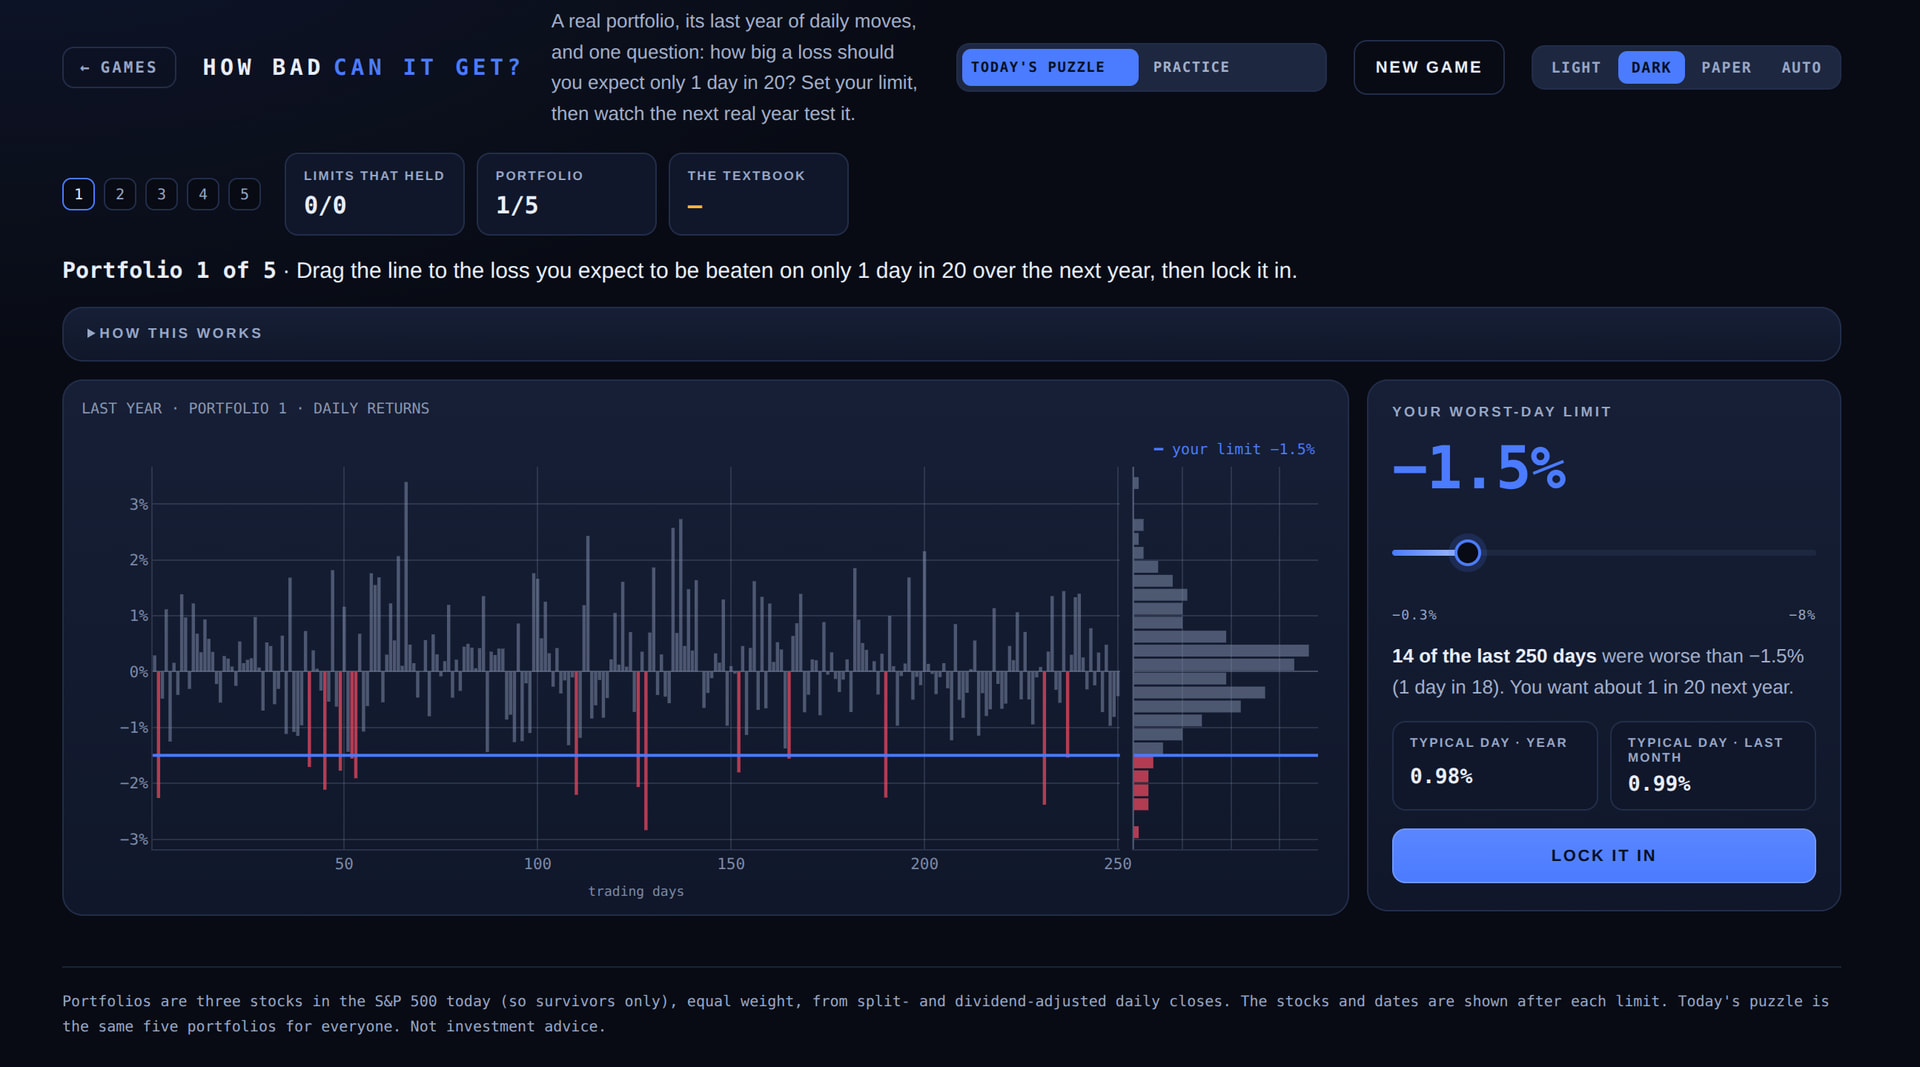
- How Bad Can It Get?: estimate a portfolio’s loss threshold, then see how often the following year breaches it.
The site uses Python, Dash and Plotly. Each game asks you to make a decision before revealing the outcome and explaining the assumptions behind it. There are daily puzzles, and no login is required.
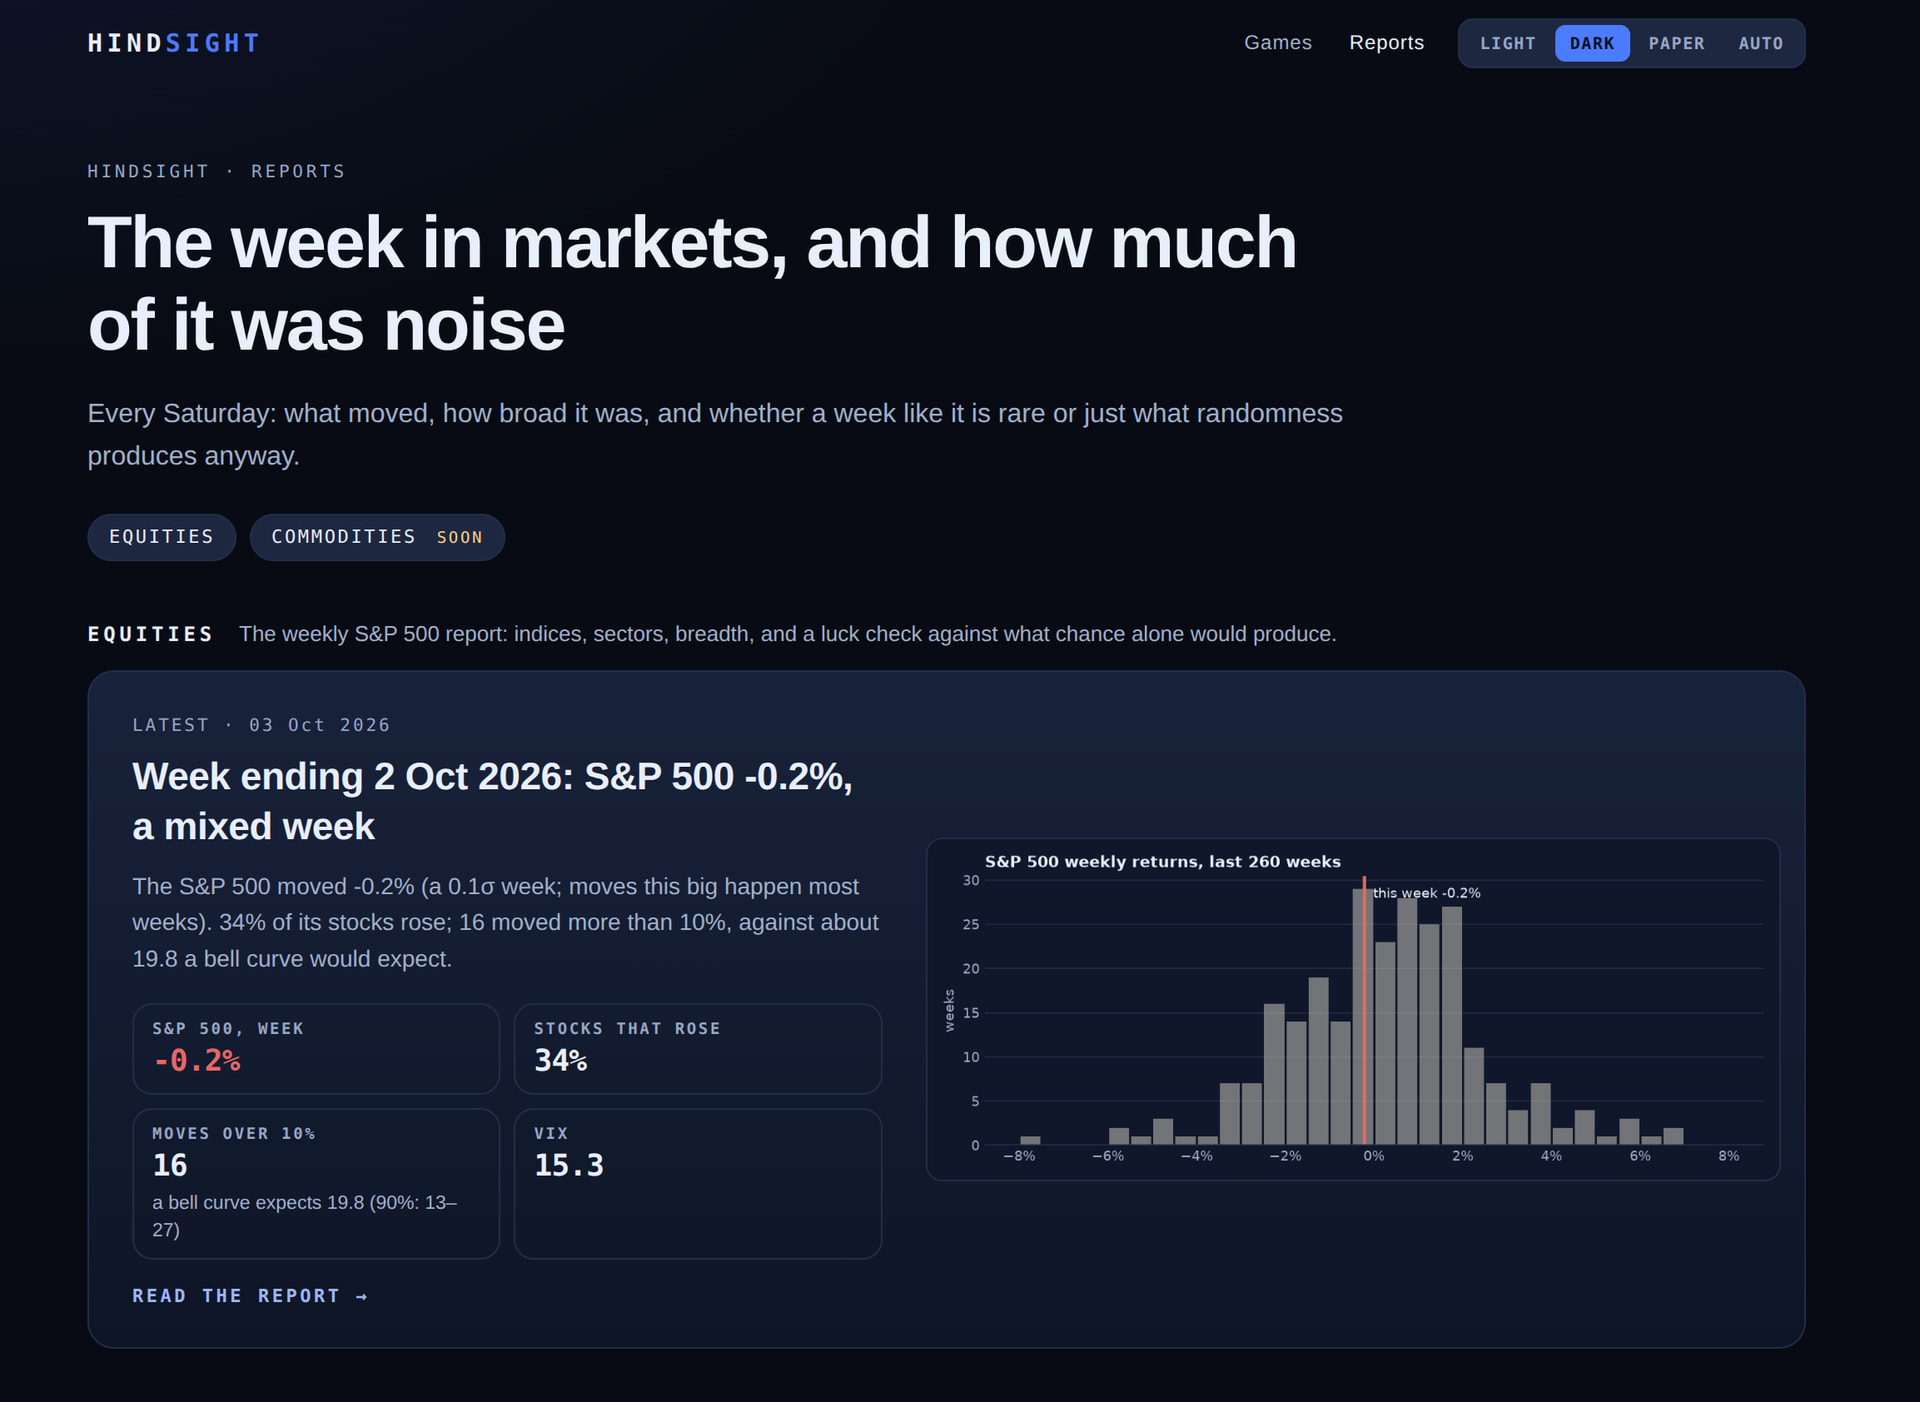
I’ve also added a weekly market report that puts market moves in statistical context.
I’d appreciate feedback on the charts and interactions, particularly whether the explanations work for someone without a quant background.
Try Hindsight ·
Hi @Pankaj_Kumar and welcome to the Dash community!
Thanks for sharing - this is really cool - and educational!
Here’s a screenshot of the “How Bad Can It Get” game - just to encourage people to click through
I like the weekly reports section too. I’m going to bookmark that page
Here’s a little more background:
Thanks, AnnMarie! Really appreciate the welcome and you adding the screenshots. Glad you found the games educational, and it’s particularly encouraging to hear that you’d bookmark the reports. I’m trying to make the statistical ideas approachable while being clear about their limitations. Thanks for taking the time to explore it!
This is a great app. In my long-term investment and trading practice, I pay close attention to the patterns between sectors with cyclical rises and falls. For example, most of the time, Asset A is mainly in a downward cycle during the upward cycle of Asset B. It would be even better if there were relevant features for this.
Thanks @CNFeffery, that means a lot coming from you!
Sector cycles are a good suggestion, and close to where I’m heading. The weekly report already has a first piece of it: each week shows how the sector ETFs moved, and how many stocks in each sector actually rose, so you can see whether a sector’s move is broad or carried by a few names:
https://hsights-1.onrender.com/reports/2026-10-03-week-40?utm_source=plotly&utm_campaign=showandtell
One week is too short to call a rotation, so the next step is to look across longer windows and check how often an apparent sector turn actually persists, which fits the Hindsight question of telling a real pattern from noise.
Your point about A falling while B rises is interesting. Do you watch this mainly between sectors within one market, or across asset classes (equities vs bonds vs commodities)? It would help me decide what to try first.
Thanks, @Pankaj_Kumar I mainly focus on individual U.S. stocks and actively traded thematic ETFs related to those sectors.