For this month’s app-building challenge, we’ve partnered with One For The World (OFTW), whose mission is to scale the effective giving movement addressing extreme poverty.
OFTW is asking the Plotly community to help it build an internal-facing data app that will provide insights into its monetary pledges and payments from 2014 to the present time. Find out more about the data at the end of the post.
OFTW’s metrics wishlist is a list of insights that OFTW is hoping to gain from the data. However, OFTW welcomes new data insights that are not part of the wishlist.
The winning apps will be judged according to the following categories:
- Data insights revealed from the dataset (how helpful the insights are to the OFTW team)
- App UI/UX Design
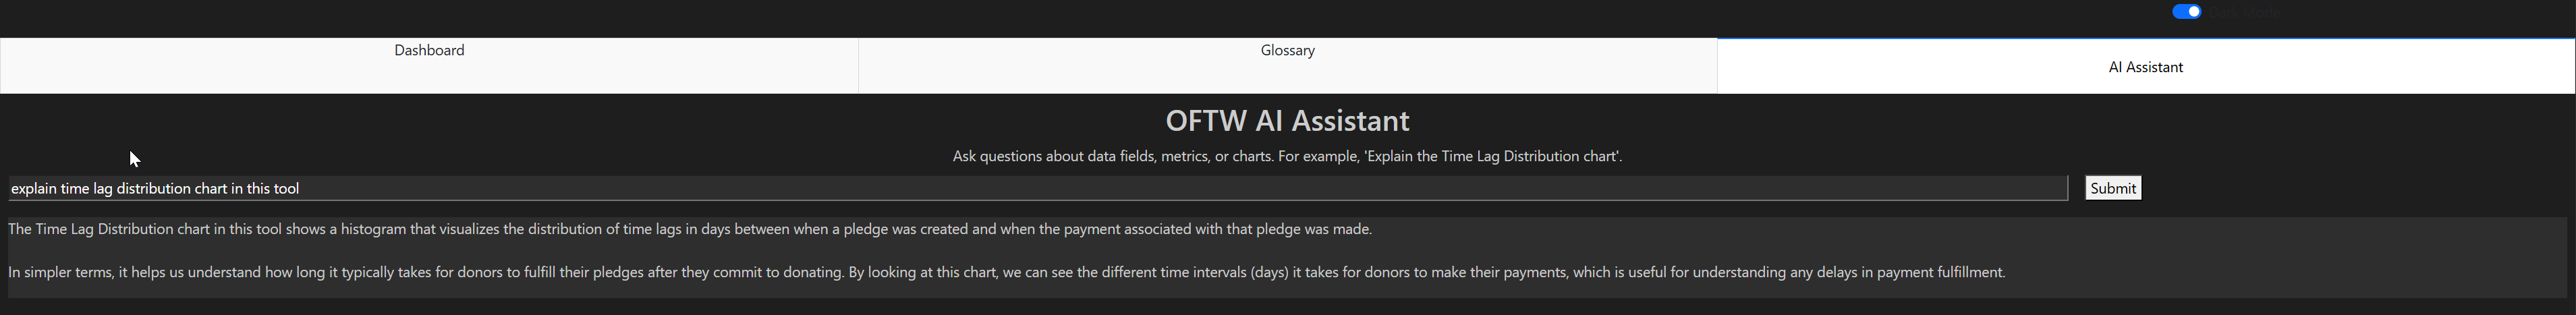
- Bonus points for integration of LLMs to facilitate app interactivity and insights
The winners will be announced at the end of April and will receive the following rewards (thank you to OFTW for contributing to the rewards):
![]() $500 USD
$500 USD
![]() $250 USD
$250 USD
![]() $100 USD
$100 USD
To submit your app, share it by replying to this Forum topic by midnight Sunday (your time zone), April 13. Please include a link to the app, the code on GitHub, and a short description of the app.
The Data:
The two datasets (pledges and payments), metadata file, and wishlist:
- https://storage.googleapis.com/plotly-app-challenge/one-for-the-world-pledges.json
- https://storage.googleapis.com/plotly-app-challenge/one-for-the-world-payments.json
- Metadata file
- OFTW’s metrics wishlist
If there is a need, both datasets can be joined with the pledge_id field. For more context, people sign up (“pledge”) to OFTW to start giving some amount in the future. Once the pledge becomes live, they start making donations (“payment”).
Getting Started:

from dash import Dash, dcc, callback, Output, Input, no_update
import dash_ag_grid as dag
import plotly.express as px
import pandas as pd

# df_pledges = pd.read_json("https://storage.googleapis.com/plotly-app-challenge/one-for-the-world-pledges.json")
df_payments = pd.read_json("https://storage.googleapis.com/plotly-app-challenge/one-for-the-world-payments.json")


fig = px.histogram(df_payments, x='payment_platform')

grid = dag.AgGrid(
    id='payments-table',
    rowData=df_payments.to_dict("records"),
    columnDefs=[{"field": i, 'filter': True, 'sortable': True} for i in df_payments.columns],
    dashGridOptions={"pagination": True}
)

app = Dash()
app.layout = [
    dcc.Markdown("# One For The World - Getting Started"),
    grid,
    dcc.Graph(id='platform-fig', figure=fig)
]


if __name__ == "__main__":
    app.run(debug=True)
Building together:
Want to work on this app with other community members? Starting March 10, we will be running weekly sessions on Plotly’s Discord server at 11am Eastern Time.