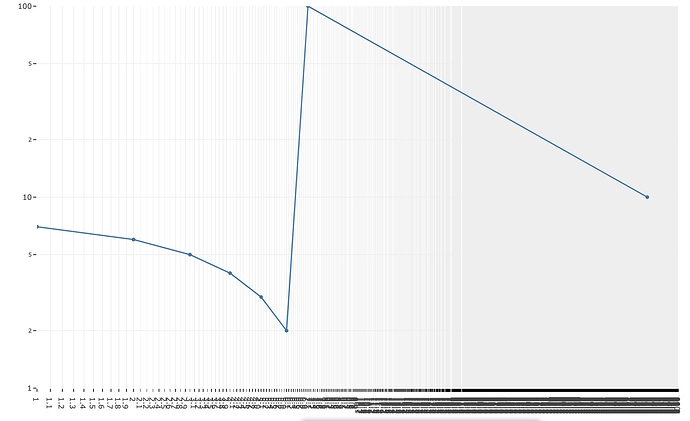
For log scales, the labels dont automatically show the actual values (see Y axis in the image below). It shows labels as (10, 2, 5, 100)
I would like to have the option to show the actual values (10, 20, 50, 100)
When I tried layout axis options on Y axis such as
    dtick: "L0.1",
    tick0: 0.10,
    tickmode: "linear"
It shows actual values but it shows all the labels instead of automatically hiding overlapping labels.
Is there a way to show actual values vs the format it’s shown and not show every single label with overlapping text?
codepen:
