Mithun
July 20, 2023, 9:07am
1
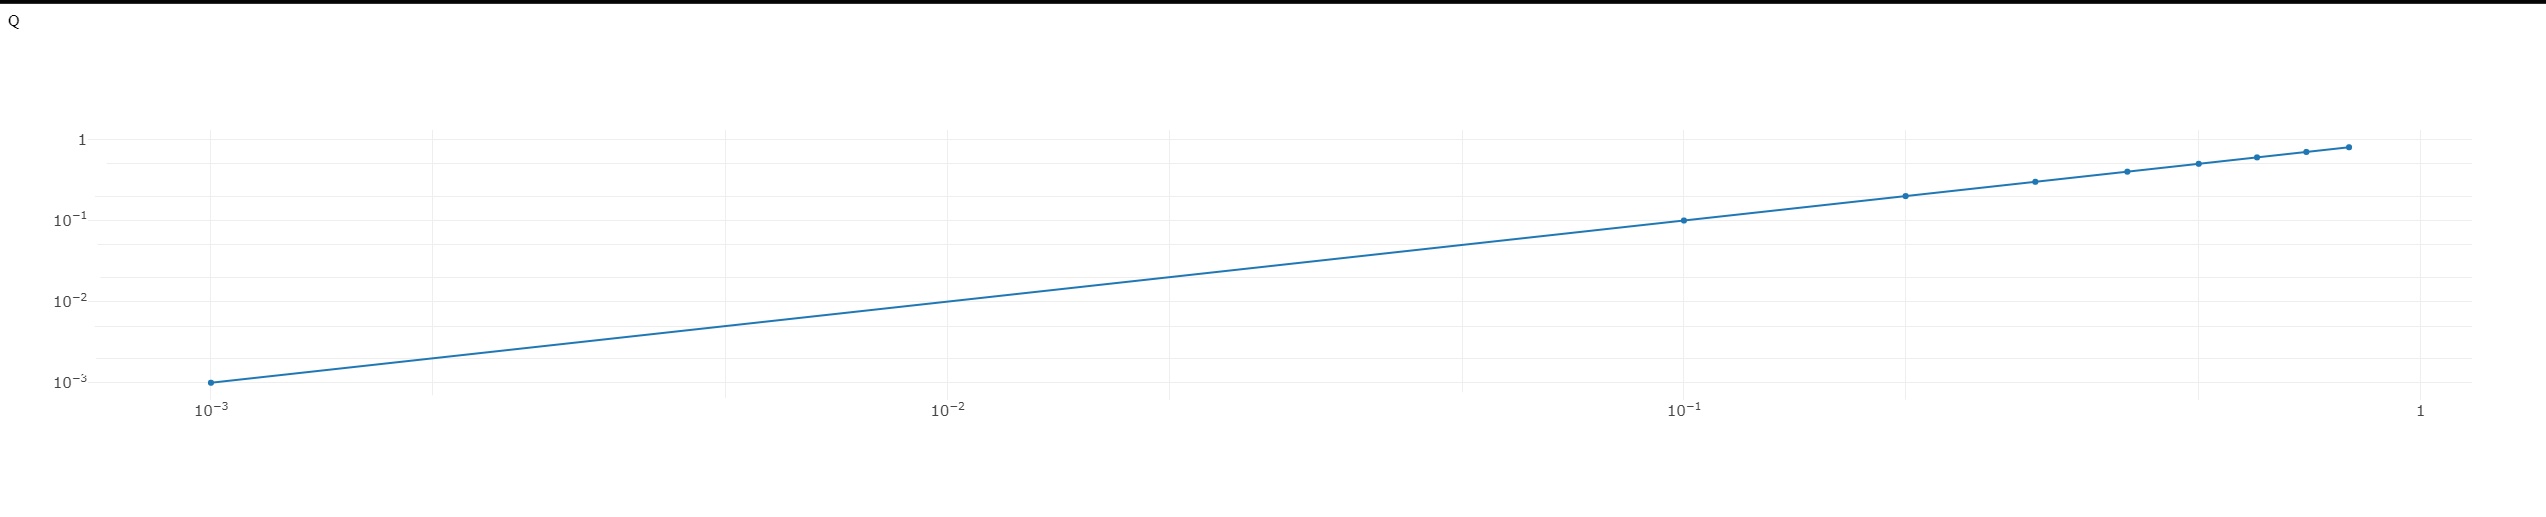
How to hide the minor ticks label in plotly js
var trace1 = {
  x: [0.8, 0.7,0.6, 0.5, 0.4, 0.3,0.2, 0.1,0.001],
  y: [0.8, 0.7,0.6, 0.5, 0.4, 0.3,0.2, 0.1,0.001],
  type: 'scatter'
};

var data = [trace1];

var layout = {
  xaxis: {
    type: 'log',
    autorange: true,
     autorange: true,
      dtick: 1,
     exponentformat: "power",
    tickmode: "auto",
  },
  yaxis: {
    type: 'log',
    autorange: true,
      dtick: 1,
    rangemode: 'tozero',
     tickmode: "auto",
    tickformat:"",
     exponentformat: "power",
  }
};
could define y-axis tickmode as array, and list the labels and lines you want to see?
    tickmode: "array",
    tickvals: [0.1, 1, 10, 100, 1000],
    ticktext: ['0.1', '1', '10', '100', '1000'],
1 Like
Mithun
July 24, 2023, 8:36am
4
2 issues with this approach
minor ticks is not available, and not scalable if range is dynamic
even if somehow managed to handle fist issue, exponentformat: "power" wont have effect in this
minor ticks is not available, and not scalable if range is dynamic
Was the objective not to hide minor ticks?
Mithun
July 25, 2023, 6:17am
6
No, I want to hide only the tick labels ,
for the array tick mode I suggested, are you against adding the additional tickvals, but with empty ticktext? I’m not certain if there are other alternatives.