Hi!
I’m new using plotly and wanted to ask if there is a straightforward way of putting more than one hex heatmap on top of the same interactive map.
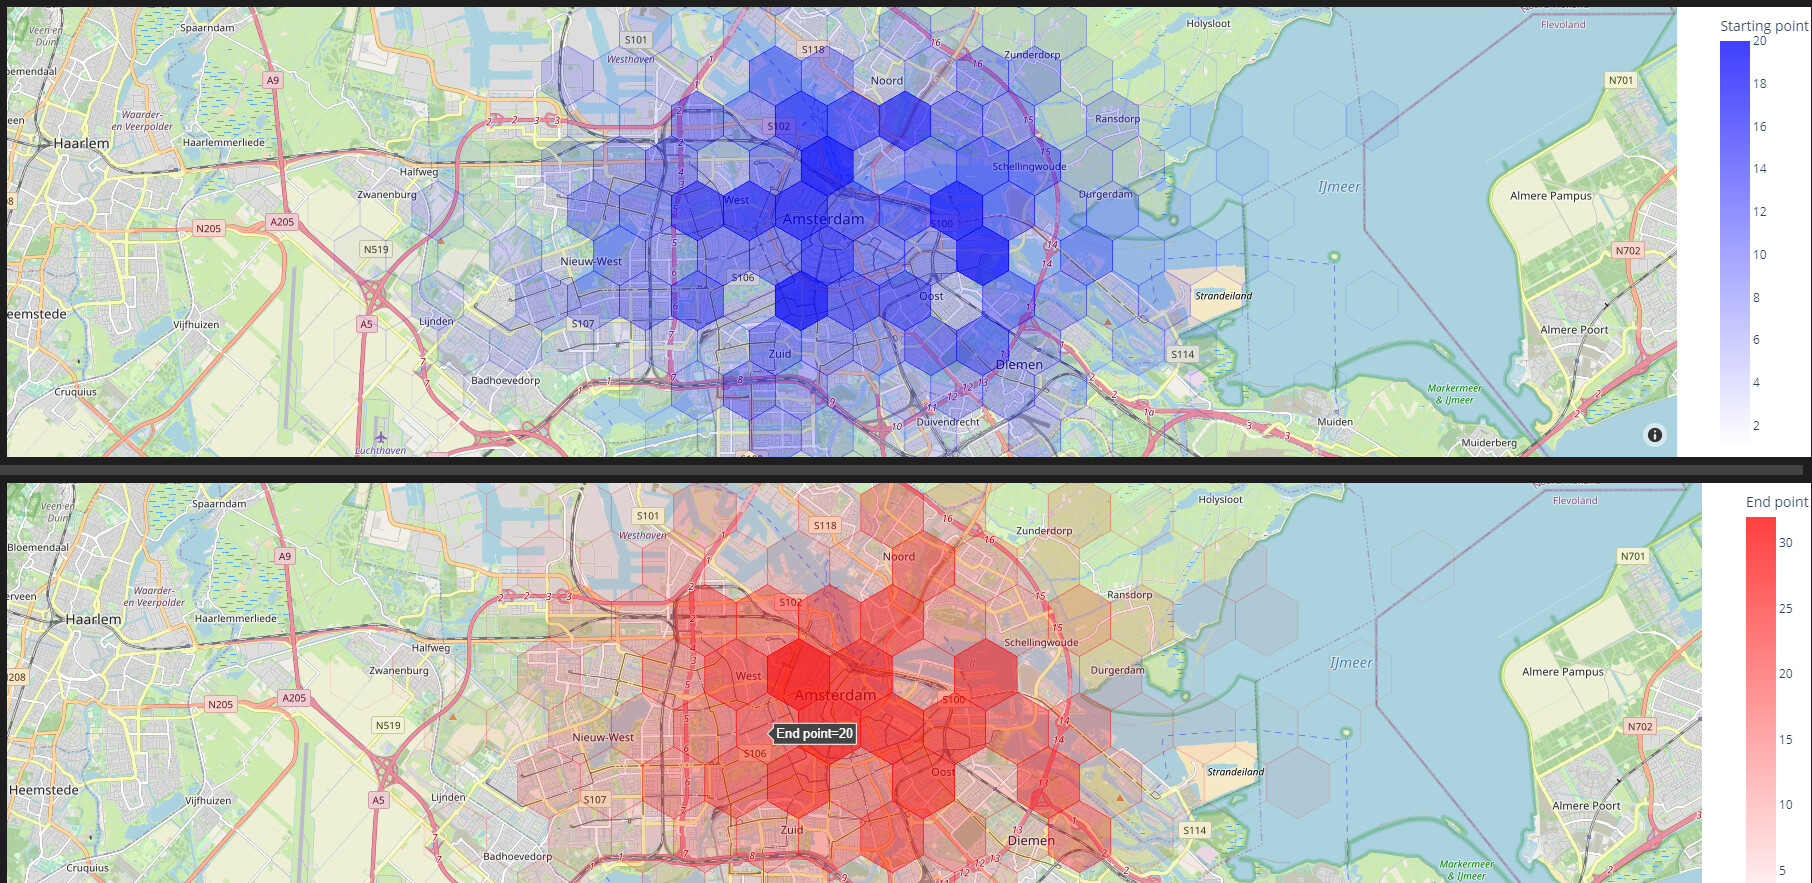
This is the code that i’m currently using for generating the hexbins:
start = ff.create_hexbin_mapbox(
    data_frame=dat1, lat="lat", lon="lon",
    nx_hexagon=20, opacity=1, labels={"color": "Starting point"},
    color_continuous_scale=[(0,"rgba(0,0,255,0)"), (1,"rgba(0,0,255,0.75)")],
    min_count=1, center={"lat":52.37, "lon":4.90}, zoom=11
    )

end = ff.create_hexbin_mapbox(
    data_frame=dat2, lat="lat", lon="lon",
    nx_hexagon=20, opacity=1, labels={"color": "End point"},
    color_continuous_scale=[(0,"rgba(255,0,0,0)"), (1,"rgba(255,0,0,0.75)")],
    min_count=1, center={"lat":52.37, "lon":4.90}, zoom=11
    )

start.update_traces(marker={"line": {"color": "rgba(0,0,255,0.1)"}}, colorbar={})
start.update_layout(mapbox_style="open-street-map")
start.update_layout(margin={"r":0,"t":0,"l":0,"b":0})

end.update_traces(marker={"line": {"color": "rgba(255,0,0,0.1)"}}, colorbar={})
end.update_layout(mapbox_style="open-street-map")
end.update_layout(margin={"r":0,"t":0,"l":0,"b":0})

start.show()
end.show()
I’ve also followed the pre-hexbin “tutortial” from here, and doing fig.add_traces(scatter_trace) on the figure created with the proper function, but the best I’ve gotten is to have the second hexbin frozen on the screen without changing size while the rest of the map is moving and scaling as expected.
Any help is appreciated!