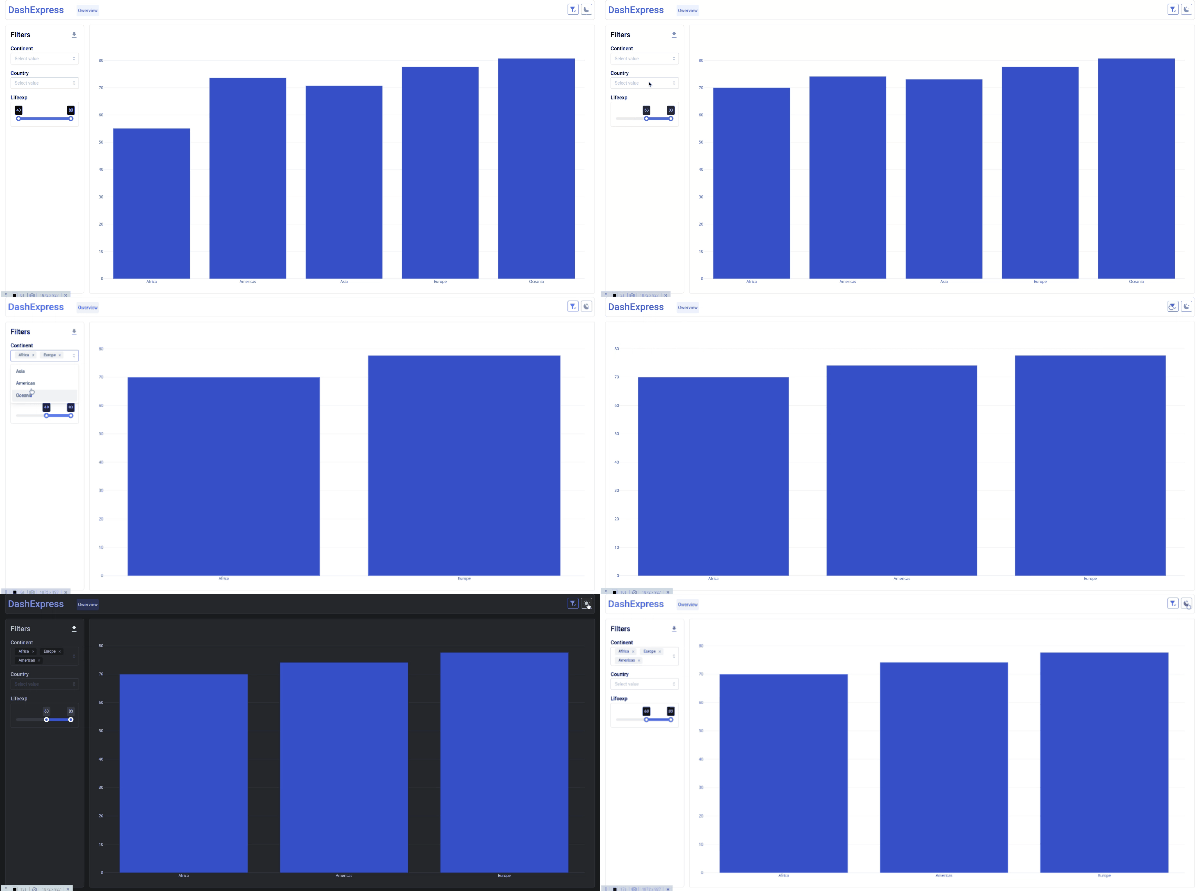
Hey! ![]()
My name is Kirill & I’m quite excited to share my first open source project with all of you: DashExpress!
pip install dash-express
Its a library of tool for faster application development Plotly Dash. Dash Express, extends the Plotly Dash, by adding responsive UI and generated automatic callback-functions. The logic of creating a Dash Express application, like any dashboard, comes down to 4 stages:
- Data collection
- Creating a layout
- Filling layouts with visualizations
- Adding filtering
Dash Express simplifies the second and fourth stages. The concept of Dash Express implies the rejection of the need to write callback functions. Despite the fact that writing such functions as a rule does not present any difficulty, it can be very tedious in the case of a large number of visualizations and (or) frequent changes in layout and content.
Basic features¶:
- Pre-configured UI
- Automatic callback functions
- Autofilters
- An alternative implementation of multipage, with support for access depending on the user
Below is an example of a minimal full-featured application

import pandas as pd
import plotly.graph_objects as go
import dash_mantine_components as dmc

from dash_express import DashExpress, Page


# Incorporate data
get_df = lambda: pd.read_csv('https://raw.githubusercontent.com/plotly/datasets/master/gapminder2007.csv')

# Initialize the app
app = DashExpress(logo='DashExpress')

# Initialize the Page
page = Page(
    app=app,                    # DashExpress app
    url_path='/',               # page url
    name='Owerview',            # page name in navigation buttons
    get_df=get_df,              # function for getting pd.DataFrame
    title='Owerview',           # page title
    )

# The logic of drawing a graph
def bar_func(df):
    pv = pd.pivot_table(df, index='continent', values='lifeExp').reset_index()
    fig = go.Figure([go.Bar(x=pv['continent'], y=pv['lifeExp'])])
    return fig

# Dashboard layout
page.layout = dmc.SimpleGrid(
    page.add_graph(h='calc(100vh - 138px)',render_func=bar_func)
    )

# By which columns to filter
page.add_autofilter('continent', multi=True)
page.add_autofilter('country', multi=True)
page.add_autofilter('lifeExp', multi=True)

app.run(debug=True)
Please read the docs website to understand how it works
English is not my native language, if I made a mistake in this message or on the documentation site, do not be afraid to correct me