Notice: This is a copy of Dash Club edition #21 that went out via email and LinkedIn on April 27.
A Decade of Open-Source: A Plotly Community Gathering & Party
Join us in San Francisco for a drop-by day of food, drinks, and talks to celebrate a decade of open-source with Plotly. We’ll hear from friends and leaders in data science, open-source, and policy. We’ll hear from partners who have been part of our journey. We’ll reflect on the past, explore new horizons, and appreciate the community that has made it all possible.

Plotly Studio and Dash Highlights
Below you will find remarkable data apps built by the community and Plotly staff members with Plotly Studio and Dash.
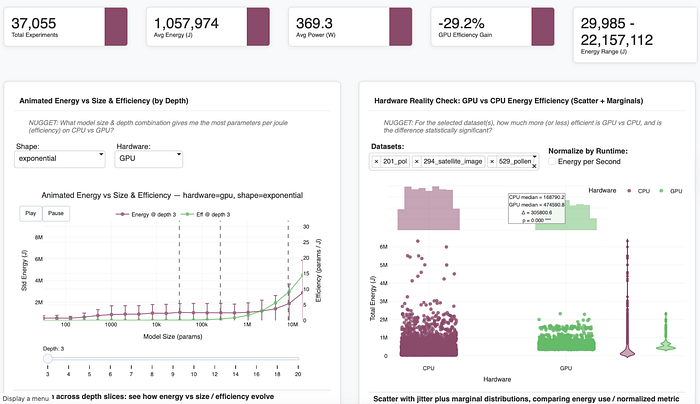
 AI Energy Consumption App built by community member, Aditya Shukla, using Plotly Studio. This app demonstrates how model architecture, hardware choices, training strategies, temporal patterns, and optimization decisions impact energy efficiency in neural network training.
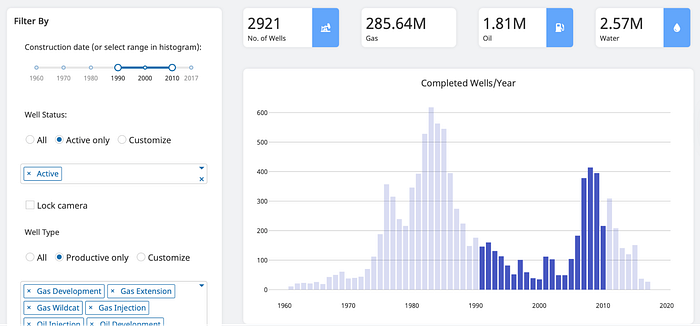
New York Oil and Gas Production App built by Plotly staff members, using Dash. This is a comprehensive overview of oil and gas wells across the state of New York from the 1960’s.
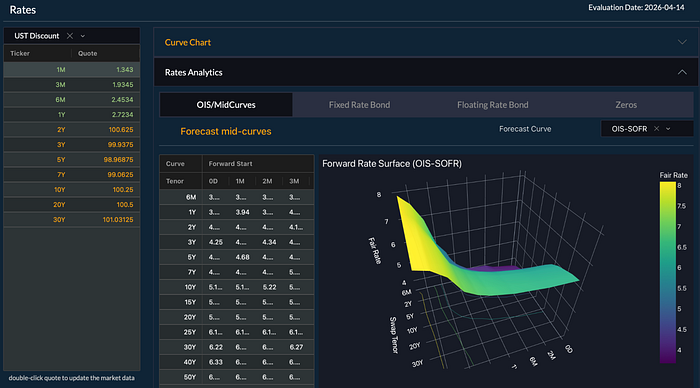
Overnight Index Swap (OIS) MidCurves Bonds dashboard built by community member, Mike Kipnis, using Dash. This is an example of an interactive utility to update OIS curves, calculate the mid-curves, and setup and price bonds.
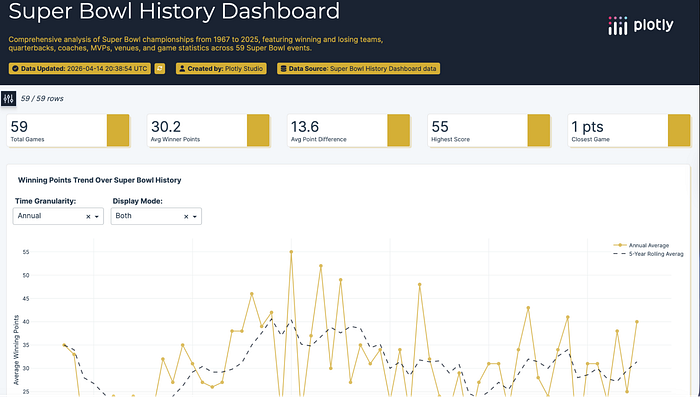
Super Bowl History Dashboard built by Plotly staff members, using Plotly Studio. An analysis of Super Bowl championships from 1967 to 2025, featuring quarterbacks, coaches, MVPs.
 Thank you everyone for creating these apps and submitting them to the Plotly Examples Page.
See more Dash and Plotly Studio apps or share your own in the community forum’s Show and Tell tag. If you would like your app to be considered for the next edition of the Dash Club newsletter or the Dash Explore Page, please submit it by clicking the Share Your App button.
Plotly IBCS Challenge Winners
Thank you to all the community members that participated in the Plotly — IBCS challenge. We loved seeing the variety of submissions, and the quality was phenomenal.
After reviewing all the submissions, the Plotly team has selected the top 3,  …
…
 1st place goes to Deepa for the prompt she created to replicate the IBCS 09 Chart. The final chart created by Plotly Studio was almost identical to the original one.
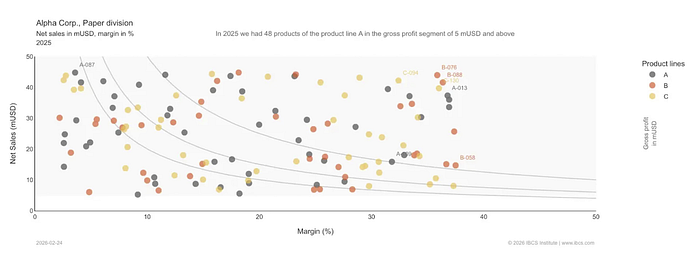
 2nd place goes to ChartCrimes for the Plotly Studio prompt that replicates the fourth IBCS chart. Although there were some overfitting results due to the detail of the prompt, the final chart was very similar to the original.
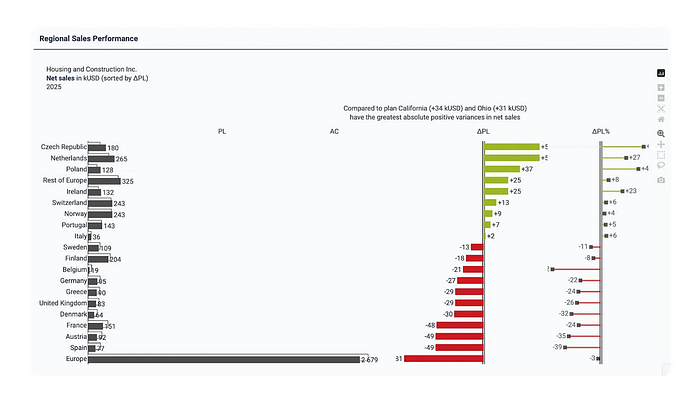
 3rd place goes to Eszter for the prompt written to replicate the 07 IBCS chart. Although the months were labeled on top of the chart instead of the bottom of the chart, this line chart is fairly similar to the original chart.
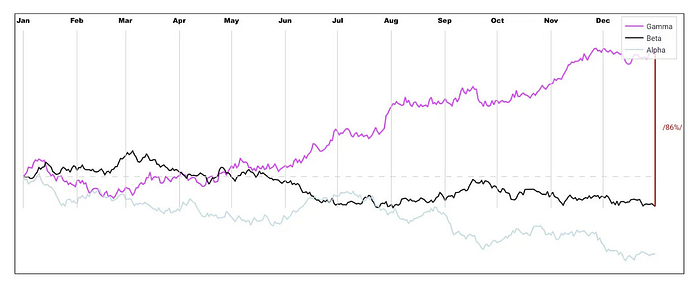
Congratulations to our winners and thank you again to all the community members who participated in this challenge.
Join our next challenge on Power BI with Plotly!
Plotly Cloud Teams
As a reminder, the quickest and easiest way to publish and share your Dash apps with others, is through Plotly Cloud. For those participating in the Power BI Plotly challenge, you will need to publish your app to Plotly Cloud as well. When you are finished building your Plotly Studio app, click the publish button, located in the top right corner. If you’re building a Dash app, simply install dash cloud (pip install “dash[cloud]”) and click the “Plotly Cloud” → “Publish App” buttons.
Plotly Cloud recently added the capability to work in teams within the teams workspaces. For example, you might want to collaborate with your team members in your data analytics department. Simply create your team and invite your colleagues via email address. Those colleagues without Plotly Cloud accounts will see your Team as soon as they sign up to Cloud and will immediately be able to access everything shared with them in the Team.
To learn more about using Plotly Cloud and Teams, read Plotly Product Manager, Nathan’s, article.
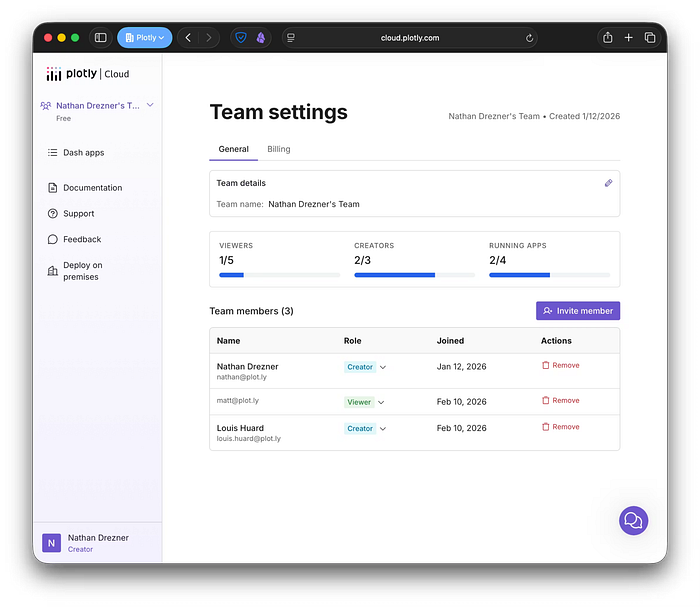
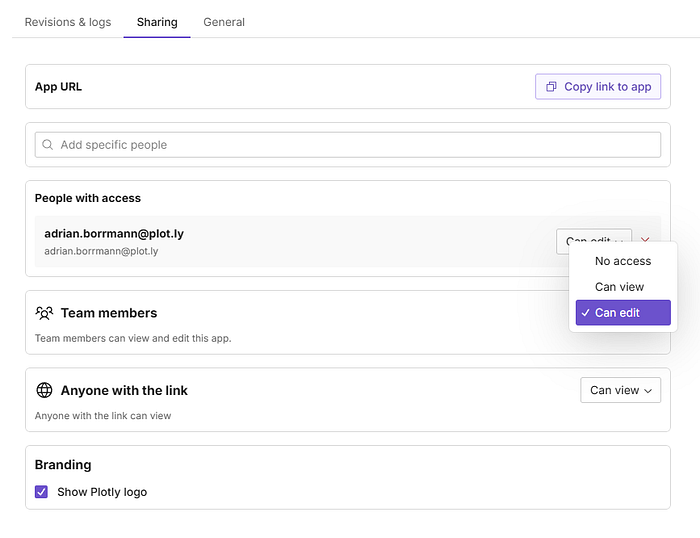
In addition, a few more recent updates expand the capabilities of Plotly Cloud:
- Published apps can use Python libraries to connect to data that lives outside of Plotly Cloud (read more).
- Enhanced Revision History Tracking. Now you are able to know exactly who made changes to your projects with new uploader information displayed in revision history
- There is better onboarding for anyone you invite with intro banners
- You can access Dash Enterprise (DE) documentation using Cloud for Enterprise accounts or DE accounts
Finally, check out the Plotly Cloud roadmap to view features that we’ve implemented, features that are in progress, and those that have been requested.
Version Check
- Dash Enterprise Platform 6.0 (docs)
- Dash Open Source Framework 4.1.0 (changelog)
- Dash AG Grid 33.3.3 (changelog)
- Plotly.py 6.7.0 (changelog)
- Plotly.js 3.5.0 (changelog)
Have a great week!