Hey,
We built an app to quickly perform standard financial performance evaluation. It is available here [https://tools.nava.capital/].
It is possible to:
Analyze time series
Perform a complete analysis of user uploaded time series. It includes line charts of the time series (standard & log), drawdown plots, performance metrics table, factor & sector based regression analysis, rolling metrics etc.
Useful graphs
Sometime, it is not useful to perform the complete analysis and just plot one graphs. One can quickly do it here. One cool plot is what we call “triangles”. It can show, for example, the outperformance of one strategy compared to the other at any investment horizon.
Time series editing
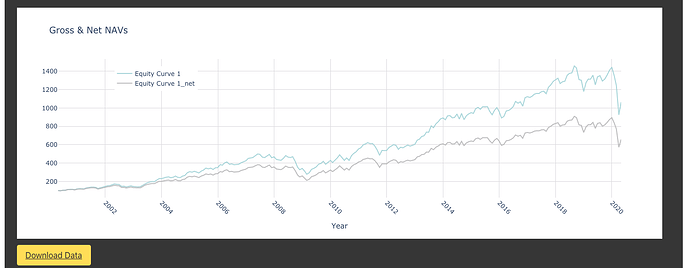
Quickly compute the time series net of fees given a level of management fee, performance fee and hurdle rate.
The app is based on Dash with bulma css. Longer computations are sent to Celery.
Feedback welcome 


 the Triagle chart.