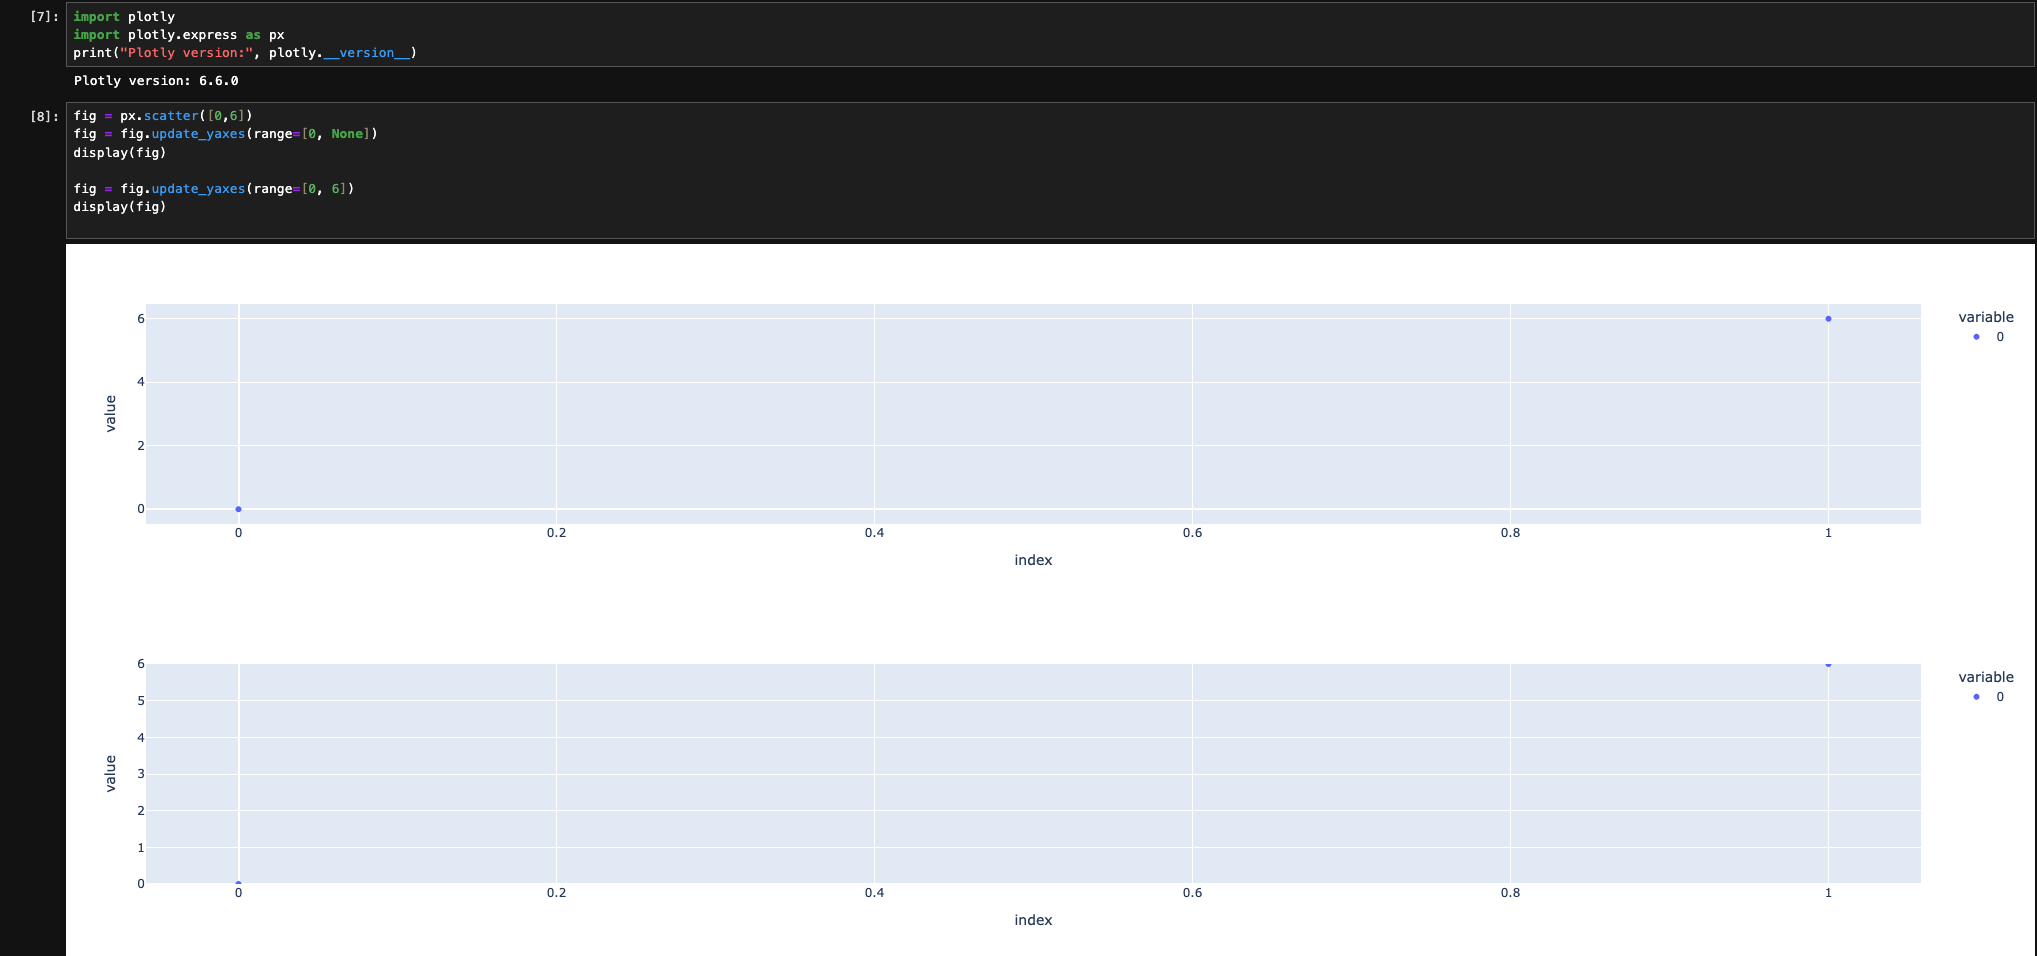
I’m trying to set the lower axis range to zero, the upper one should stay auto. However I don’t see axis changing when I set one of the bounds to be None. My plotly version is 6.6
Hello! My use case is often to set the axis to start at zero but I don’t want to touch the upper limit. In this simple case I know the highest value exacatly, in real use I often handle data where I don’t know the maximum span (and also don’t want to hardcode it as it changes often).
I understand. How do you create the figure? At some when populating with data, you should be able to extract the maximum and adjust the ranges. That’s why I was asking for the use case.