Hey there,
I am trying to plot multiple Indicators on a heatmap, and result a table similar to the following:

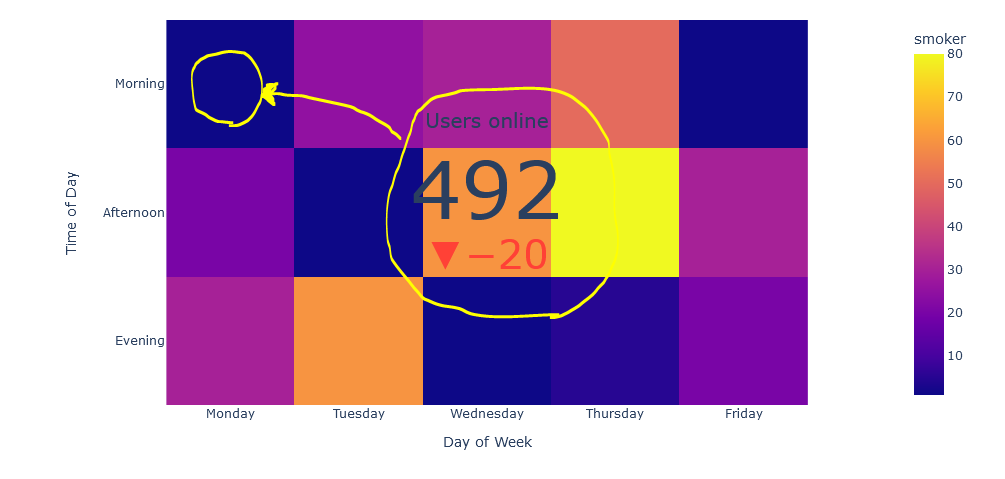
I tried to plot a single Indicator on a heatmap, but couldn’t place it to the desired place on the plot. How can I plot them to the middle of boxes?
Placing on “Morning” and “Monday” box for instance here:
import plotly.express as px
import plotly.graph_objects as go

data=[[1, 25, 30, 50, 1], [20, 1, 60, 80, 30], [30, 60, 1, 5, 20]]

fig = px.imshow(
    data,
    labels=dict(x="Day of Week", y="Time of Day", color="Productivity"),
    x=['Monday', 'Tuesday', 'Wednesday', 'Thursday', 'Friday'],
    y=['Morning', 'Afternoon', 'Evening']
)

fig.add_trace(
    go.Indicator(
        mode = "number+delta",
        value = 492,
        delta = {"reference": 512, "valueformat": ".0f"},
        title = {"text": "Users online"},
        domain = {'y': [0, 1], 'x': [0.25, 0.75]})
)

fig.show()
P.S. Just one example will be enough because I will place indicators iteratively.