zxdawn
January 21, 2019, 12:50pm
1
lon and lat are both 2D value and 2D array v is the corresponding value at each lon and lat.
Here’s an example:
import numpy as np
import plotly.plotly as py
import plotly.graph_objs as go

lon = np.array([[120,125,122],[123,135,121]])
lat = np.array([[20,22,25],[27,21,28]])
v = np.array([[1,10,100],[24,47,50]])

trace = go.Heatmap(z=v,x=lon,y=lat)
data=[trace]
py.iplot(data, filename='labelled-heatmap')
jmmease
January 22, 2019, 10:52am
2
Hi @zxdawn ,
Could you explain in more detail how you would like the information to be displayed? Here are the raw points that you have:
scatter = go.Scatter(x=np.array(lon).flatten(),
                     y=np.array(lat).flatten(),
                     marker={'color': np.array(v).flatten(),
                             'showscale': True},
                     mode='markers')
fig = go.FigureWidget(data=[scatter],
                      layout={'xaxis': {'title': 'lon'},
                              'yaxis': {'title': 'lat'}})
fig
What would you like the heatmap x/y coordinates to be, and what do you want to do when multiple points fall in the same bin?
-Jon
zxdawn
January 23, 2019, 2:16am
3
Hi @jmmease ,
Sorry for this unclear example. After checking the definition of heatmap , I find heatmap isn’t the method I want.
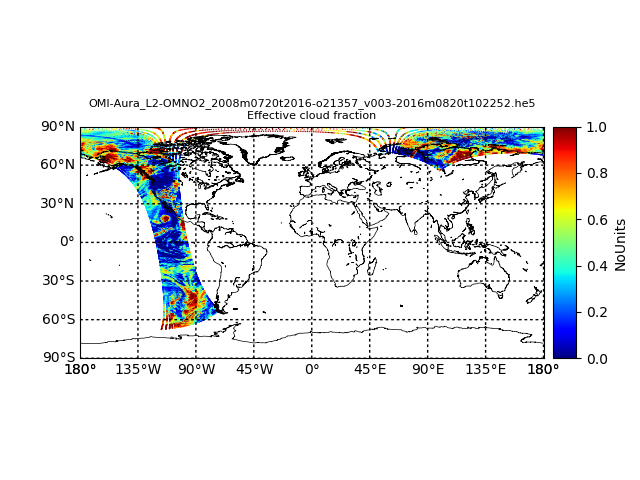
Actually, You can check the example here : the part of OMI including data, figure and plotting script.
I want to check the value of each pixel like heatmap. Is there any similar functions of plotly for pixels ?
jmmease
January 23, 2019, 10:39am
4
Hi @zxdawn ,
Looking closely at the figure:
and the code
It looks like this is actually a really dense scatter plot with small markers and color scaled by a colormap.
Something similar to https://plot.ly/python/line-and-scatter/#scatter-with-a-color-dimension with small markers, where the underlying data is positioned on a grid.
Hope that helps!
-Jon
zxdawn
January 23, 2019, 2:22pm
5
@jmmease Thank you for your advice.
However, this script doesn’t work for 2D array of coordinates:
import os

import matplotlib as mpl
import matplotlib.pyplot as plt
from mpl_toolkits.basemap import Basemap
import numpy as np
import h5py

import plotly.graph_objs as go
import plotly.plotly as py

FILE_NAME = 'OMI-Aura_L2-OMNO2_2008m0720t2016-o21357_v003-2016m0820t102252.he5'
path = '/HDFEOS/SWATHS/ColumnAmountNO2/Data Fields/'
DATAFIELD_NAME = path + 'CloudFraction'
f = h5py.File(FILE_NAME, mode='r')
dset = f[DATAFIELD_NAME]
data =dset[:].astype(np.float64)

# Retrieve any attributes that may be needed later.
# String attributes actually come in as the bytes type and should
# be decoded to UTF-8 (python3).
scale = f[DATAFIELD_NAME].attrs['ScaleFactor']
offset = f[DATAFIELD_NAME].attrs['Offset']
missing_value = f[DATAFIELD_NAME].attrs['MissingValue']
fill_value = f[DATAFIELD_NAME].attrs['_FillValue']
title = f[DATAFIELD_NAME].attrs['Title'].decode()
units = f[DATAFIELD_NAME].attrs['Units'].decode()

# Retrieve the geolocation data.
path = '/HDFEOS/SWATHS/ColumnAmountNO2/Geolocation Fields/'
latitude = f[path + 'Latitude'][:]
longitude = f[path + 'Longitude'][:]

data[data == missing_value] = np.nan
data[data == fill_value] = np.nan
data = scale * (data - offset)
datam = np.ma.masked_where(np.isnan(data), data)

# Draw an equidistant cylindrical projection using the low resolution
# coastline database.

# m = Basemap(projection='cyl', resolution='l',
#             llcrnrlat=-90, urcrnrlat = 90,
#             llcrnrlon=-180, urcrnrlon = 180)
# m.drawcoastlines(linewidth=0.5)
# m.drawparallels(np.arange(-90., 120., 30.), labels=[1, 0, 0, 0])
# m.drawmeridians(np.arange(-180, 180., 45.), labels=[0, 0, 0, 1])

# m.scatter(longitude, latitude, c=datam, s=1, cmap=plt.cm.jet,
#          edgecolors=None, linewidth=0)

trace1 = go.Scatter(
    x = longitude,
    y = latitude,
    mode='markers',
    marker=dict(
#         size=16,
        color = datam, #set color equal to a variable
        colorscale='Viridis',
        showscale=True
    )
)

data = [trace1]

py.iplot(data, filename='scatter-plot-with-colorscale')
jmmease
January 24, 2019, 10:38am
6
Hi @zxdawn ,
You’re right that scatter won’t handle a 2D array the way you’re intending. You’ll probably need to flatten the latitude and longitude arrays first. E.g.
latitude = np.array(latitude).flatten()
longitude = np.array(longitude).flatten()
-Jon
zxdawn
January 24, 2019, 12:05pm
7
Hi @jmmease ,
Thanks. It works now:
You can see that scatters can’t represent satellite pixels well. Is there any function like pcolormesh?
jmmease
January 25, 2019, 11:21am
8
Hi @zxdawn ,
Unfortunately plotly.js doesn’t support non-rectangular 2D heatmaps/meshes.
-Jon