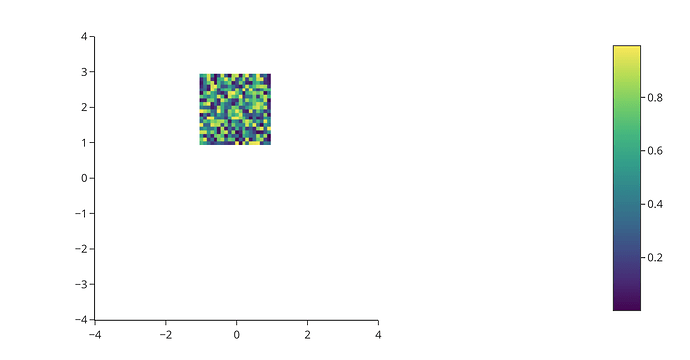
It is possible to draw this in plotly?
Yes, it is possible to get such a plot defining a figure that consists in an empty scatter plot, and a Heatmap defined as an inset:
import plotly.graph_objs as go
import numpy as np

trace1 = go.Scatter(x=[-4, 4],
                    y=[-4, 4],
                    mode='markers',
                    marker_size=0.1)

trace2 = go.Heatmap(
    z=np.random.rand(400).reshape((20,20)),
    colorscale='Viridis',
    showscale=False,
    xaxis='x2',
    yaxis='y2'
)
fig = go.Figure(data=[trace1, trace2])

axis_style= dict(showline=True,
                 zeroline=False,
                 showgrid=False,
                 mirror=True,
                 ticklen=3,
                 range=[-4, 4])

fig.update_layout(width=500, height=500,
                  template='none',
                  xaxis =axis_style,
                  yaxis=axis_style,

                  xaxis2=dict(domain=[0.33, 0.67],
                               anchor='y2',
                               visible=False),
                  yaxis2=dict(domain=[0.61, 0.95],
                                anchor='x2',
                                visible=False))
    ```
1 Like
Thank you for your help!
This version does it in a single subplot… a bit more tweaking in the update_*axes can get you the ticks you want and the lines on the right and top 
fig = px.imshow(
    np.random.rand(400).reshape((20,20)),
    x=np.arange(-1,1,0.1),
    y=np.arange(1,3,0.1),
    origin="lower",
    color_continuous_scale="Viridis",
    template="simple_white"
)
fig.update_xaxes(range=[-4,4], autorange=False)
fig.update_yaxes(range=[-4,4], autorange=False)
fig.show()
1 Like
It’s more succint using plotly.express. Thank you!
Hello,
Revived this topic because i have a problem with x axis.
Based on Empet’s approach i tried this:
import plotly.graph_objs as go
import numpy as np
from matplotlib.colors import LightSource
import matplotlib.pyplot as plt

dem = np.load('topo.npz')

z = dem['elevation']

dx, dy = dem['dx'], dem['dy']

dy = 111200 * dy
dx = 111200 * dx * np.cos(np.radians(dem['ymin']))

ls = LightSource(azdeg=315, altdeg=45)

cmap = plt.cm.gist_earth

rgb = ls.shade(z, cmap=cmap,vmin=0,vmax=2500, blend_mode='overlay',vert_exag=5, dx=dx, dy=dy)
img = np.array((255*rgb[:, :, :3]+0.5), int)

# MAP BOUNDARIES (latitude and longitude)
lon_min = dem['xmin']  # 28.18
lon_max = dem['xmax']  # 28.88
lat_min = dem['ymin']  # 37.50
lat_max = dem['ymax']  # 37.88

# Dummy for map boundaries
trace1 =go.Scatter(x=[],y=[],

                    mode='markers',
                    marker_size=0.1)

trace2 =go.Image(z=img,xaxis='x2',yaxis='y2')

fig = go.Figure(data=[trace1, trace2])


fig.update_layout(
                xaxis =  dict(visible=True,  range=[lon_min, lon_max],),
                yaxis =  dict(visible=True,  range=[lat_min, lat_max]),
                xaxis2 = dict(visible=False),
                yaxis2 = dict(visible=False,autorange=True),
                )

fig.show()
My x axis does not correspond to given boundaries (28.11 - 28.88)
How can i fix this ?
Best regards.
If anyone else have the same problem here’s the solution :
import plotly.graph_objs as go
import numpy as np
from matplotlib.colors import LightSource
import matplotlib.pyplot as plt

dem = np.load('topo.npz')

z = dem['elevation']

dx, dy = dem['dx'], dem['dy']

dy = 111200 * dy
dx = 111200 * dx * np.cos(np.radians(dem['ymin']))

ls = LightSource(azdeg=315, altdeg=45)

cmap = plt.cm.gist_earth

rgb = ls.shade(z, cmap=cmap,vmin=50,vmax=3000, blend_mode='overlay',vert_exag=8, dx=dx, dy=dy)
img = np.array((255*rgb[:, :, :3]+0.5), int)

# MAP BOUNDARIES (latitude and longitude)
lon_min = dem['xmin']  # 28.18
lon_max = dem['xmax']  # 28.88
lat_min = dem['ymin']  # 37.50
lat_max = dem['ymax']  # 37.88


# Dummy for map boundaries

fig=go.Figure(go.Scatter(x=[],y=[],
                        mode='markers',
                        marker_size=0.1
                         )
              )


fig.add_trace(go.Image(z=img,
                       xaxis='x2',yaxis='y2',
                       customdata=np.round(z,2),
                       hovertemplate='Elavation (m): %{customdata}<extra></extra>'
                       )
              )


fig.update_layout(hovermode='closest',

                    xaxis =  dict(visible=True,

                                  showline=True,
                                  linewidth=3,
                                  linecolor='black',
                                  mirror=True,
                                  side='top',

                                  ticks='outside',
                                  tickwidth=2,
                                  ticklen=5,
                                  tickcolor='black',


                                  range=[lon_min, lon_max],
                                  tick0=lon_min, dtick=0.01
                                  ),

                    yaxis =  dict(visible=True,

                                  showline=True,
                                  linewidth=3,
                                  linecolor='black',
                                  mirror=True,

                                  ticks='outside',
                                  tickwidth=2,
                                  ticklen=5,
                                  tickcolor='black',


                                  range=[lat_min, lat_max],
                                  tick0=lat_min, dtick=0.01
                                  ),


                    xaxis2 = dict(visible=False,
                                  matches='y2'
                                  ),

                    yaxis2 = dict(visible=False,
                                  autorange=True,
                                  scaleanchor='x2'
                                  )

                )


fig.show()```


