Plotly equivalent to Matplotlib pcolormesh for plotting raster image on map

Hello,
I am new to Plotly, and I am struggling to achieve something very simple in Matplotlib. I want to plot a geolocalised raster image on a map. I have 3 matrixes of the same shape: latitude, longitude and and radiance for each pixel.

In Matplotlib this is simply done like this:

map = Basemap(ax=ax, projection='lcc', resolution='l', lat_0=lat_0, lon_0=lon_0,
        llcrnrlon=lon_min, urcrnrlon=lon_max, llcrnrlat=lat_min, urcrnrlat=lat_max)
x, y = map(lon, lat)
map.pcolormesh(x, y, rad)

What is the equivalent in Plotly?

Hi @Guiux welcome to the forum ,

like a heatmap?

1 Like

@Guiux Could you post an image containing the plot resulted when running the above matplotlib code?
We are not familiar with matplotlib to understand exactly what that code generates.
Plotly has no trace type, called pcolormesh. Comparing with the matplotlib examples of colormesh found on the web, pcolormesh β€” Matplotlib 3.1.0 documentation, it seems to be a plotly heatmap:


or a contour plot.

2 Likes

Yes, a heatmap would do it indeed. Except, I do not find how to combine this with an actual map.

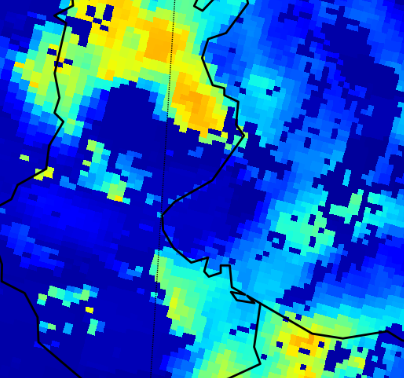
This is an example of result of using a Basemap and Matplotlib colormesh:

Hi,

You can find general information about maps:

Here your specific case (I guess):

Here is something similar but using a scatterplot instead of a heatmap:

Thanks. I had checked the general page about maps in Plotly, but did not see any kind of plot matching what I want to do.

Unless I missed some options of the scatter or heatmap, I don’t think they are adapted.

What I am looking for is just a simple grid of contiguous pixels, colored by level. This is what I get if I zoom on the Matplotlib plot:

image

What do you mean by that? Is the second image using your data and plotly mapbox? Maybe your data uses a different CRS than the underlying map in plotly (if this makes sense).

@Guiux
With Plotly you can add images on mapbox maps.

  1. Image from a url:
import  plotly.graph_objects as  go

fig1 = go.Figure(go.Scattermapbox(), layout=dict(width=700, height=500))
mapboxt = open(".mapbox_token").read().rstrip() #my  mapbox access token
mapbox = dict(zoom= 4.5, 
              accesstoken=mapboxt,
              style='light',  #set here your prefered mapbox style 
              center=dict(
                        lat=42, 
                        lon=-74.5), 
              layers=[
                  dict(
                  below ='',    
                  source = "https://docs.mapbox.com/mapbox-gl-js/assets/radar.gif", 
                  sourcetype= "image", 
                  coordinates =  [
                          [-80.425, 46.437], [-71.516, 46.437], [-71.516, 37.936], [-80.425, 37.93]
                                 ])
                     ])             
fig1.update_layout(mapbox=mapbox) 

  1. local image
import  plotly.graph_objects as  go
import numpy as np
import base64, io
# create an image:
h= 0.05
y, x = np.mgrid[-5 : 5  : h, -5 : 10 : h]
z = np.sin(x)**10 + np.cos(10 + y*x) + np.cos(x) + 0.2*y + 0.1*x
fig2 =go.Figure(go.Heatmap(x= x[0, :], y = y[:, 0], z=z, colorscale="Blues", showscale=False))
fig2.update_layout(width=500, height=300, xaxis_showticklabels=False, yaxis_showticklabels=False,
                  margin=dict(t=0, r=0, b=0, l=0)  ### Very important to set margins=0!!!!

#define  an empty Scattermapbox  to put our image on the base map
b = io.BytesIO(fig2.to_image(format="png"))
b64 = base64.b64encode(b.getvalue())
imgsource= "data:image/png;base64,"+b64.decode("utf-8")

fig3 = go.Figure(go.Scattermapbox())
mapboxt = open(".mapbox_token").read().rstrip() #my  mapbox access token
mapbox2 = dict(zoom= 4.35, 
              accesstoken=mapboxt,
              style='open-street-map',  #set here your prefered mapbox style 
              center=dict(
                        lat=43, 
                        lon=-75.5), 
              layers=[
                  dict(
                  #below ='',    
                  source = imgsource, 
                  sourcetype= "image", 
                  coordinates =  [
                          [-80.425, 46.437], [-75.516, 46.437], [-75.516, 43.936], [-80.425, 43.93]
                                 ])
                     ])      
                             
fig3.update_layout(mapbox=mapbox2) 

local_image

This image can be placed in a oblique position, too.

1 Like