This Plotly Studio application presents a comprehensive analysis of UK oil and gas field production data, covering production volumes, field operations, and regional performance across both offshore and onshore facilities from 1975 to 2025.
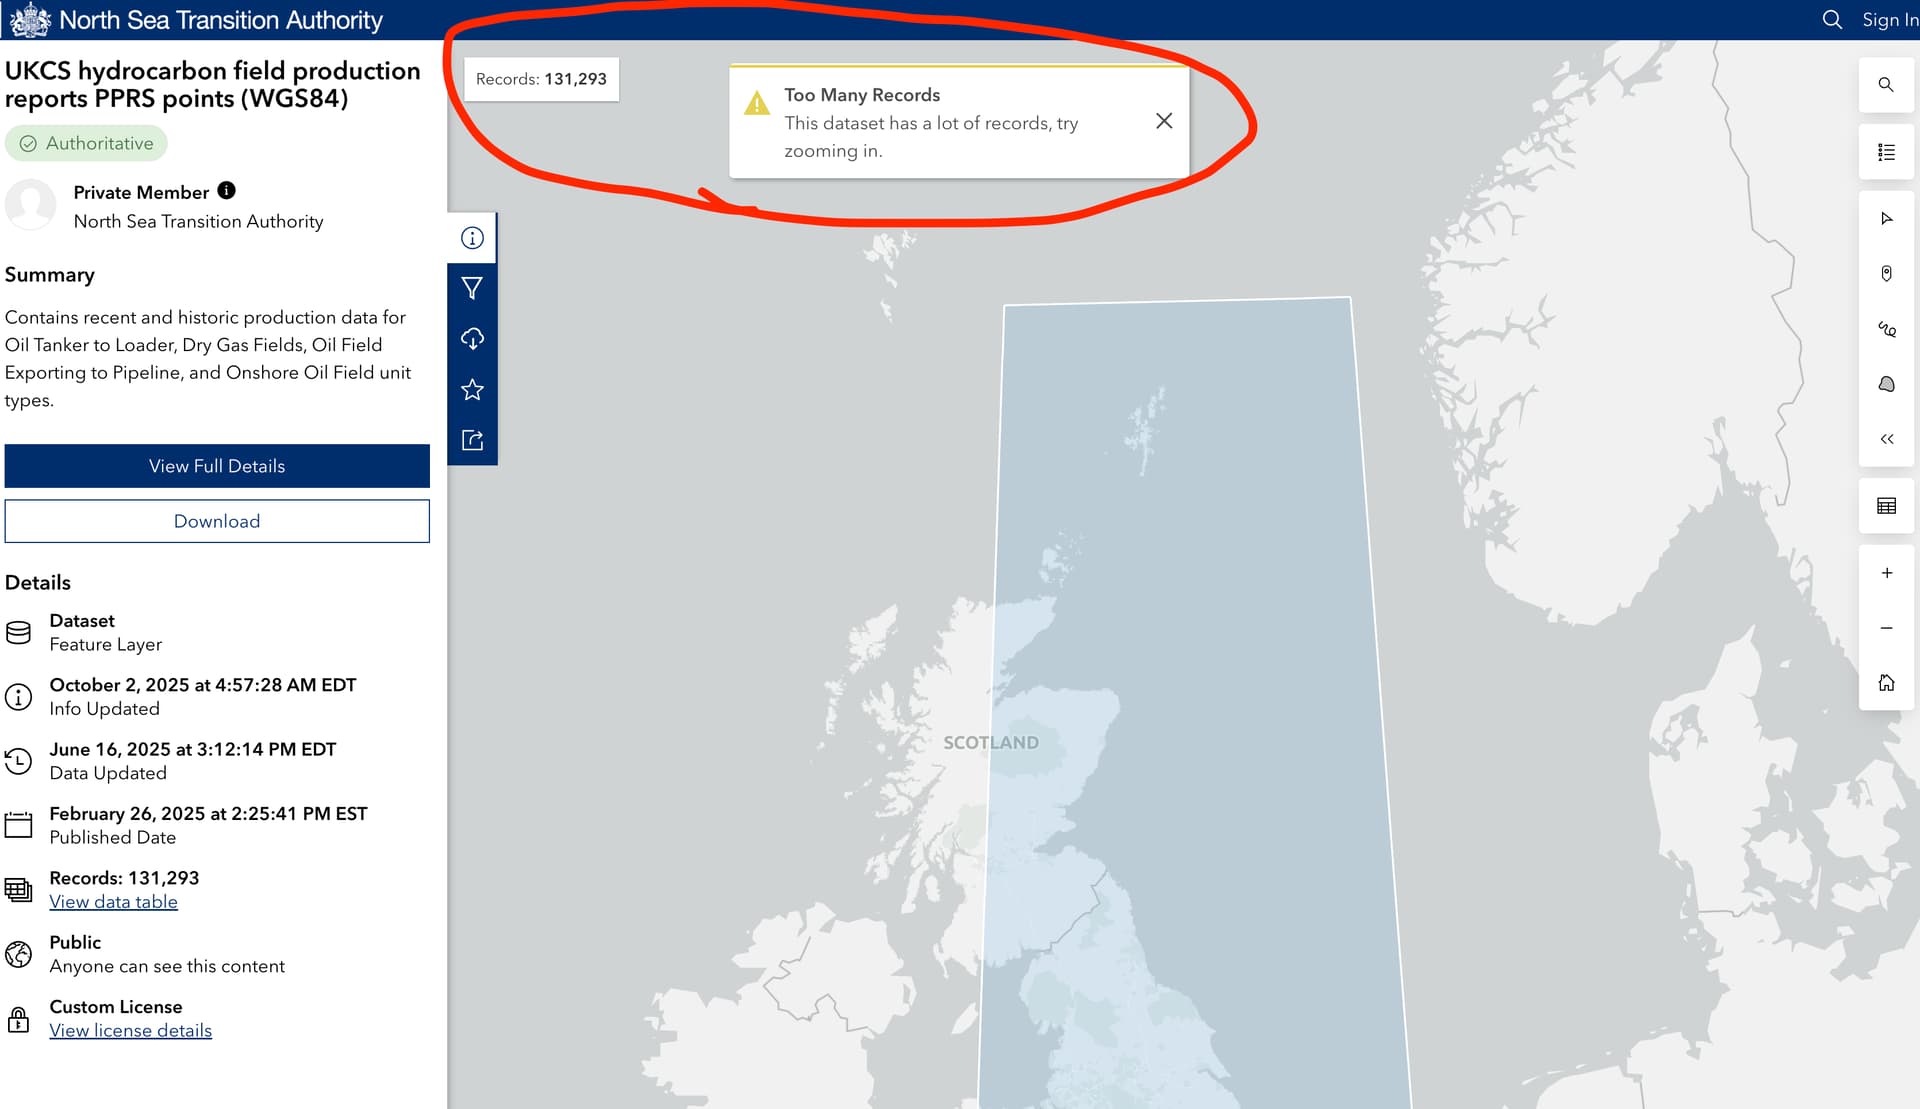
The data is based on: UKCS hydrocarbon field production reports PPRS points (WGS84) (38.7MB csv file)
When I first attempted to explore the data using the website’s default tool, it failed to load due to the file size:
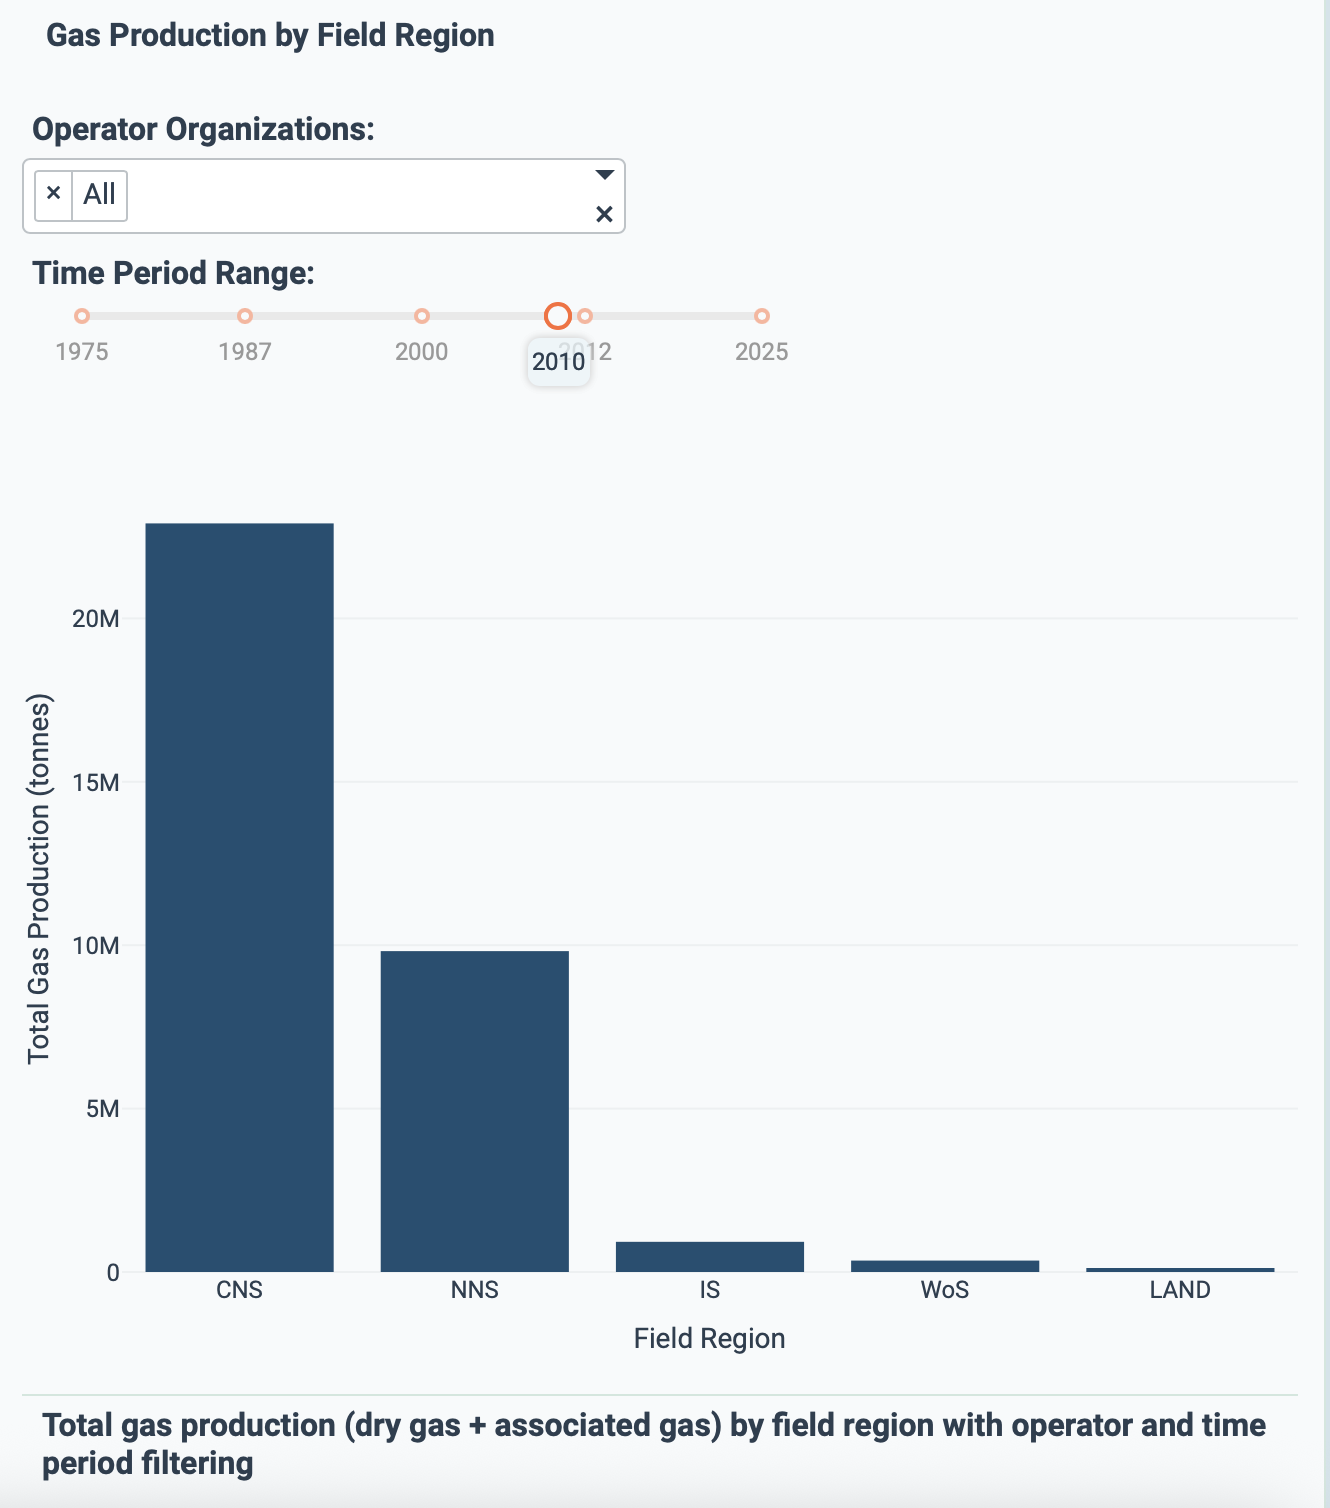
But after uploading the CSV into Plotly Studio, an interactive dashboard was generated in seconds using AI-powered prompts — delivering a rich, in-depth analysis without any manual setup.

You can access this Dash app on Plotly Cloud and explore the dataset: https://dbaefe91-8f69-469e-8eb9-f502e826ee7c.plotly.app