Thanks. I had checked the general page about maps in Plotly, but did not see any kind of plot matching what I want to do.
Unless I missed some options of the scatter or heatmap, I don’t think they are adapted.
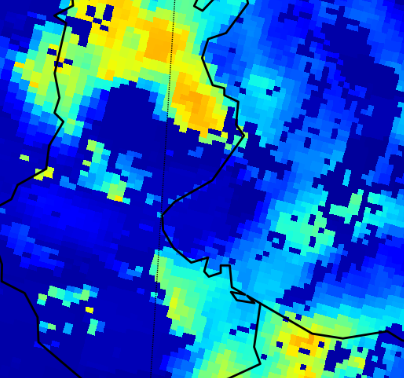
What I am looking for is just a simple grid of contiguous pixels, colored by level. This is what I get if I zoom on the Matplotlib plot:

