Hey all!
When I first started working for Plotly, as part of my Onboarding project, I spent my first week building a Dash App to analyze Chess Games from the Lichess Platform. This was loads of fun, but must have taken me more than 30 hours.
Today, I tried to repeat this project, but this time using Plotly Studio, and clocked in at less than two hours for an arguably superior result, a 20X in efficiency!
I started out with a dataset of played chess games on the online platform Lichess and in a few minutes, I was already looking at some really cool charts!
Opening Win-Rates
This first one ranks the win-rates depending on the first move played by either White or Black. It’s a nice touch that the number of games for each bar is easily visible.
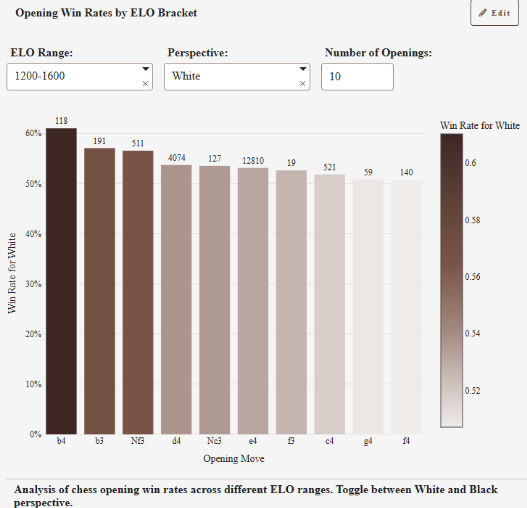
It would be better with Book Openings instead of just first move. All I had to do here was provide Plotly Studio with a List of Book Moves, in the Data module in order to augment each game with the opening played

And then modify the chart’s Outline:

One minute later, I had the perfect chart to pick the next opening I should study! (Looks like I’ll be working on the King’s Indian Attack!)

Opening Sequence Popularity
By far, the most interesting chart generated was this Sunburst Diagram showing the popularity of different move sequences.
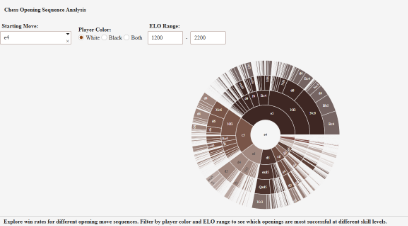
The initial generation is slightly cluttered, and it would be nice to be able to click through in order to follow move sequences through a game. It was trickier to get the exact behavior I was looking for, but definitely worth the effort!
Publishing:
One click-later, and my App is now deployed to Plotly Cloud, here!