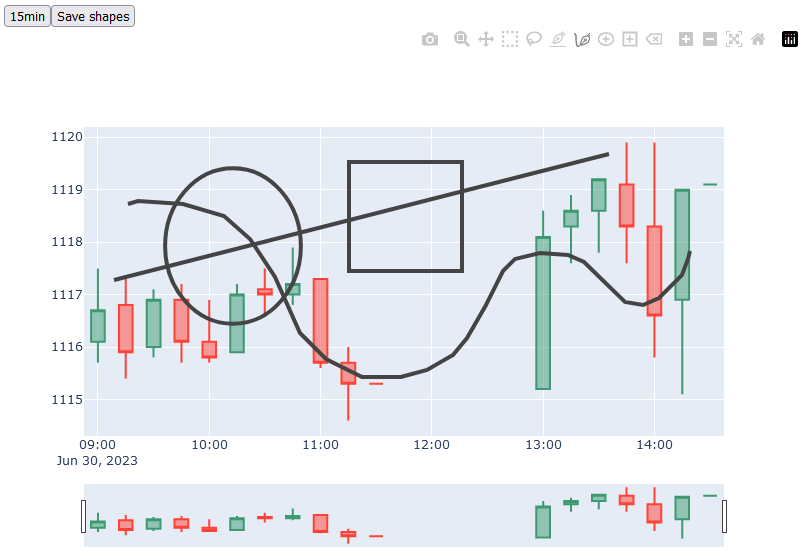
I’m looking for a way to save user drawings (using Plotly toolbar such as lines, rectangle…) and then load and draw them again. Is it possible to do this?
HI @uzimaster I did this in a Dash app, but in pure plotly I wouldn’t know how to acieve this.
I’m working with Dash, too. Would you might to tell me how to do it?
Sure. I have some apps in my github dealing with shapes/annotations:
If I remember correctly, this should be an example:
In general, all drawings are stored in a list in the figure layout:
figure['layout']['shapes']
Thank you! I was able to save and load user shapes to my chart with Plotly add_shape() function, and they showed up nicely. But as soon as I updated my figure (with new data, for example), those shapes disappeared, while new shapes added by hand still remain.
Anyone has any idea how to solve that, please?
To demonstrate the issue, I have created a Dash app called shapes-test.py in my public repo at GitHub - tariusagi/plotly-dash-lab: A repo for experimenting with Plotly and Dash. It allow user to save existing ‘editable’ shapes (created by using mode bar toolbox) to file, and load it into chart during page load.
If you run this app (“python shapes-test.py”), it will load 3 shapes from “shapes.json” and add to the figure. Then you draw any number of shapes using mode bar toolbox, such as a freehand line like the second screenshot here. When you’re done, click the timeframe button to swith to 5 or 15 minute timeframe, you will see that only newly drawn shapes using mouse on browser remain, the shapes added by code vanish. Note that I use uirevision to persist editable shapes between figure data updates.
How can I keep the loaded shapes from disappearing while updating figure data, like the one drawn by hand?
For your convenient, this is my code:
#!/usr/bin/python3
import os
import json
import pandas as pd
import plotly.graph_objects as go
from dash import Dash, dcc, html, Input, Output, State, callback
from dash.exceptions import PreventUpdate

data_path = 'ohlc-data.json'
uirevision = 1

app = Dash(__name__)

app.layout = html.Div(
	[
		html.Button('Toggle timeframe', id='timeframe', n_clicks=0),
		html.Button('Save shapes', id='save', n_clicks=0),
		html.Label('', id='info'),
		dcc.Graph(
			id='chart',
			config=dict(
				displayModeBar=True,
				modeBarButtonsToAdd=[
					'drawline',
					'drawopenpath',
					'drawcircle',
					'drawrect',
					'eraseshape'
				]
			)
		),
	]
)

# Display an candlestick chart with shapes loaded from file.
@callback(
	Output('chart', 'figure'),
	Output('timeframe', 'children'),
	Input('timeframe', 'n_clicks')
)
def on_timeframe(n_clicks):
	if n_clicks % 2:
		tf = '5min'
	else:
		tf = '15min'
	# Read data from file and build the OHLC series.
	srcdf = pd.read_json(data_path)
	sr = srcdf.groupby('DateTime').Close.last()
	ohlc = sr.resample(tf).agg({'Open': 'first', 'High': 'max', 'Low': 'min', 'Close': 'last'})
	# Create a figure with a candlestick chart using the above OHLCD data.
	fig = go.Figure(layout=dict(width=800, height=600, uirevision=uirevision))
	fig.add_trace(go.Candlestick(x=ohlc.index, open=ohlc.Open, high=ohlc.High, low=ohlc.Low, close=ohlc.Close))
	# Now add saved shapes (only once at page load).
	if n_clicks == 0:
		path = 'shapes.json'
		if os.path.isfile(path):
			with open(path , 'r') as f:
				shapes = json.load(f)
			if len(shapes):
				for shape in shapes:
					fig.add_shape(shape)
	return fig, tf

# Save existing 'editable' shapes to file.
@callback(
	Output('info', 'children'),
	Input('save', 'n_clicks'),
	State('chart', 'figure')
)
def on_save(n_clicks, fig):
	if n_clicks:
		if 'shapes' in fig['layout'].keys():
			shapes = []
			for shape in fig['layout']['shapes']:
				if shape is not None and 'editable' in shape.keys():
					shapes.append(shape)
			if len(shapes):
				path = 'shapes.json'
				print(f'Saving {len(shapes)} shapes to {path}')
				with open(path, 'w') as f:
					json.dump(shapes, f)
				return f"{len(shapes)} shapes were saved to {path}"
		return "No shape to save"
	else:
		raise PreventUpdate

if __name__ == '__main__':
	app.run(debug=True)


