Hello, My Friends ![]()
Alhamdulillah, I finished my interactive Dash App Dashboard, so I’m excited to share my dashboard with you ![]()
• Home Page
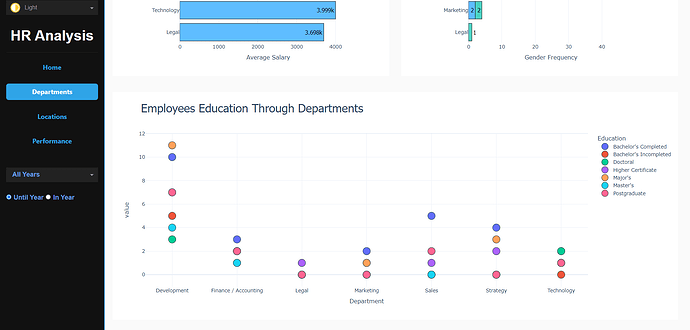
• Departments Page
• Performance Page in Dark Mode
![]() Dashboard Try to answer the following questions
Dashboard Try to answer the following questions
![]() What is the total number of employees?
What is the total number of employees? ![]()
![]() How many job positions (job titles) are there in our company?!
How many job positions (job titles) are there in our company?! ![]()
![]() What is the average salary in our company?!
What is the average salary in our company?! ![]()
![]() help you to be aware of the basic information of your company (business) firsthand…
help you to be aware of the basic information of your company (business) firsthand… ![]()
![]() Gender frequency and the frequency of your employees in each department??
Gender frequency and the frequency of your employees in each department?? ![]()
![]() The frequency of your employees through the education level??
The frequency of your employees through the education level?? ![]()
![]() these insights will help you know the distribution of your employees:
these insights will help you know the distribution of your employees:
► What is the department with the highest number of employees to compare later with average salary and productivity?
► At your company, what is the top education level of your employees, and what is the lowest?
![]() What is the average salary of employees for each department?
What is the average salary of employees for each department?
![]() Locations of your employees??
Locations of your employees?? ![]()
![]() The performance rate
The performance rate ![]()
![]() help you measure the effectiveness of your performance review process.
help you measure the effectiveness of your performance review process.
![]() Number of Terminated and Promoted Employees!!
Number of Terminated and Promoted Employees!! ![]()
![]() What is the employee turnover rate?!?
What is the employee turnover rate?!?
![]() helps you measure the company’s ability to retain employees.
helps you measure the company’s ability to retain employees.
![]() Features
Features ![]() :
:
![]() Of course, there are filters that give you full interactivity while using.
Of course, there are filters that give you full interactivity while using.![]()
![]() Change The App Theme (Light/Dark)
Change The App Theme (Light/Dark)
Dataset and Source Code
GitHub Repo For Source Code
Dash App
Live Interactive Plotly Dash App


