Your Plotly community members answer a great majority of the questions posted on the forum. However, responders’ time is limited. To greatly increase your chances of getting your post answered, your questions need to be easy to read and easy to reply to . This post will illustrate exactly how to do that.
- TL;DR: jump to section WHILE POSTING.
BEFORE POSTING:
-
Often, strange or problematic behaviour has been fixed in the most recent version of
dashor ofplotlyso always ensure you’re using the latest versions if you can. The latest versions are available from PyPI: dash · PyPI and plotly · PyPI -
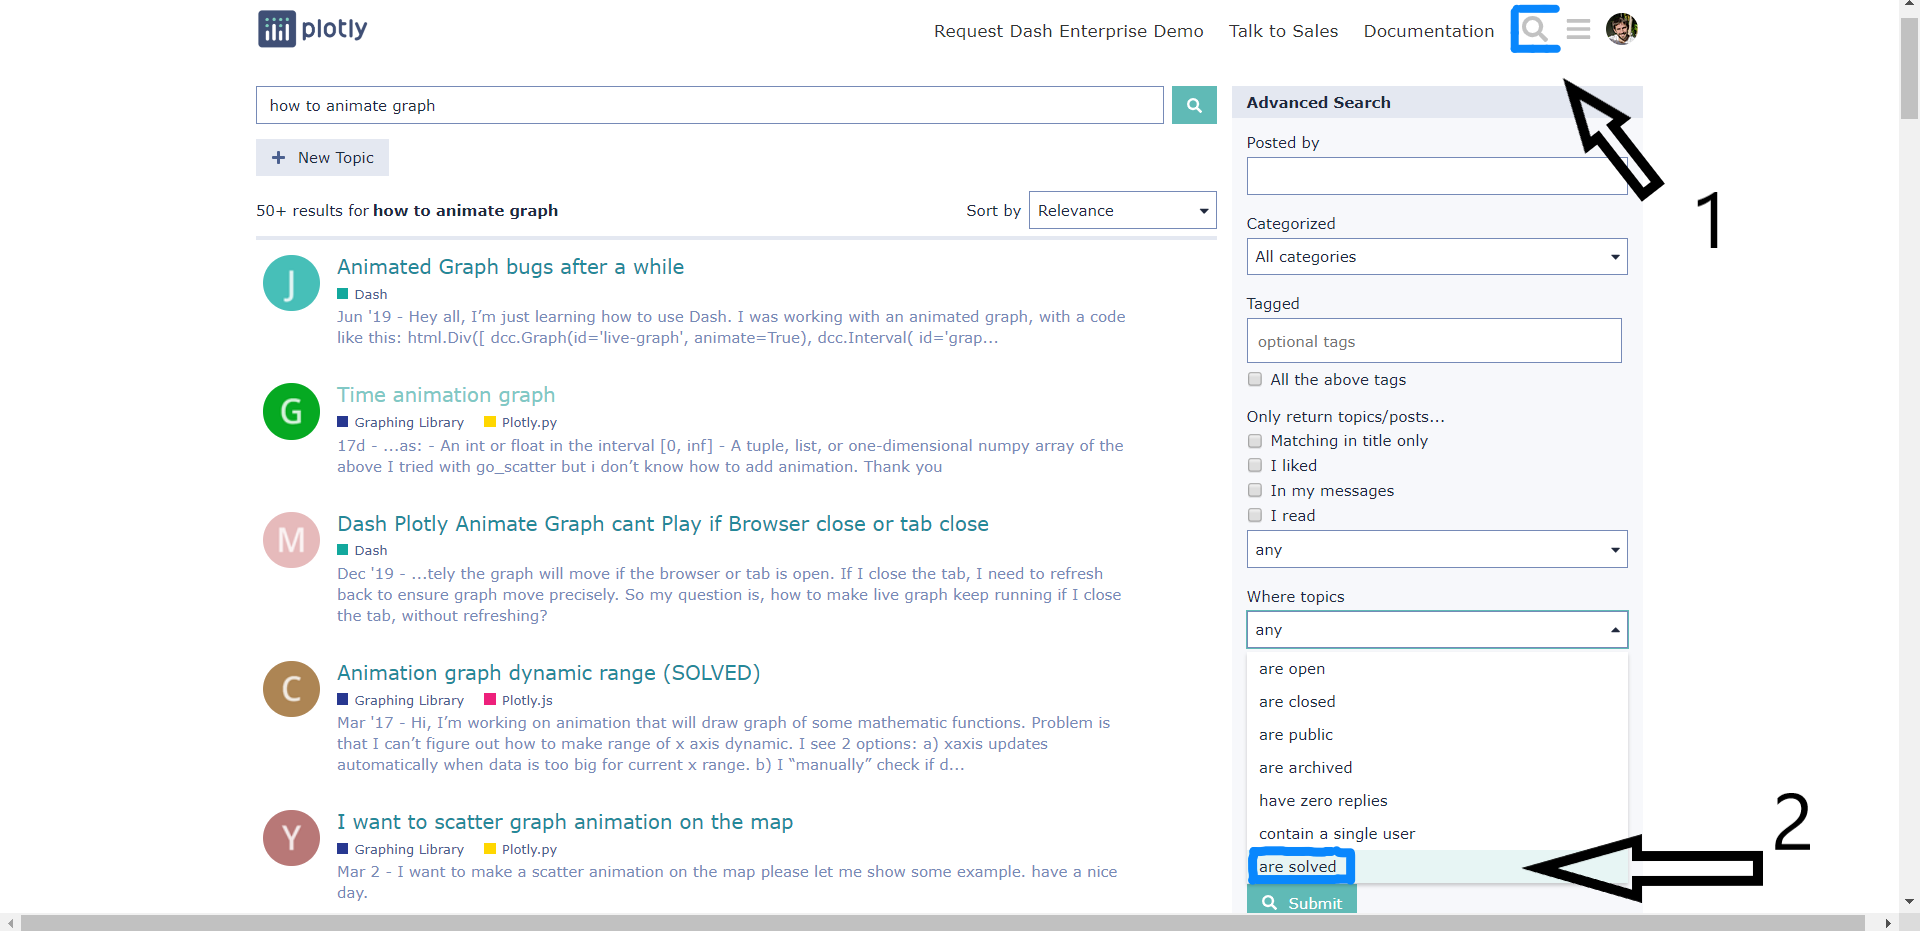
It is very likely that someone has already asked and received an answer to the same question you have. So, before you ask your question, make sure to do a quick search for answers. Use the Plotly Forum to search for answers by typing your question or coding error message inside the “Find” section.

- Put yourself in the shoes of the responders. Read a couple of solved questions and try to understand why these questions received an answer. To search for solved posts, use the “Advanced Search” section after searching for a topic.
- Read the official documentation and use the documentation’s search features instead of relying on 3rd party sources. We update the documentation frequently and the library is frequently updated. When searching on Google, try searching with:
site:dash.plotly.com <your-search-term>.
WHILE POSTING:
1. Be Clear:
-
Explain what your problem is and what you are trying to solve in clear, concise, and simple English.
-
Share the exact wording of your error message and what line of code produced it.
-
Include the version numbers and your operating system. For example,
Plotly version 4.8.0, Dash version 1.12.0, Windows operating system.
You can find these versions by doing:
print(dash.__version__),print(dcc.__version__),print(html.__version__),print(dash_table.__version__),print(plotly.__version__) -
Check your version against the latest versions announced in this forum or in the CHANGELOG. If you are on an older version, try upgrading.
-
Share a screenshot of your plot if that helps convey the error.
-
Before posting your code, use a formatting tool to improve readability (https://black.vercel.app/)
-
Always put your code inside Preformatted text. It is very unclear and extremely time-consuming to read code that is not preformatted.

2. Be Minimal:
-
Ask one question per post.
-
Include simplified, short code by taking out everything that is not related to the problem. Either
-
Restart from scratch. Create a new program, adding in only what is needed to see the problem. Use simple, descriptive names for functions and variables – don’t copy the names you’re using in your existing code.
-
Divide and conquer. If you’re not sure what the source of the problem is, create a copy of your project and then start removing code a bit at a time until the problem disappears – then add the last part back.
Most of the time it’s easier and more informative to start from scratch in order to find the root of the issue. Many times you will end up solving your own issue by going through this process. (Trust us, we’ve been there!). The more code there is to go through, the less likely people can find your problem.
-
-
Use dummy data. Many responders are familiar with plotly express dummy datasets, such as
px.data.gapminder()andpx.data.tips(). View the full list of dummy datasets. -
Or create your own synthetic data. For example,
y = [‘purple’, ’red’, ’yellow’] x = [‘grape’, ’wine’, ’banana’] -
Or create a subset of your data, using
head().
3. Be Reproducible:
-
Add all the packages/libraries that are needed inside the code.
-
Don’t forget to add the data when necessary.
-
Test your code to make sure that it can be run by others. When a potential responder copies and pastes your code into their console, they should get the exact same error you got.
AFTER POSTING:
-
Wait! Give the community a day or two to answer your post.
-
If you did not get a reply to your post after waiting, try to update your question so it is coherent and saves more time for potential responders:
-
Ensure your post is Clear, Minimal, Reproducible.
-
Reframe your post’s title if necessary.
-
Try to clarify your question.
-
Provide an update on things you have implemented to try to solve the problem since your original post.
-
-
If you found the solution to your question, make sure to reply to your own post, so the Plotly community can learn from you.
-
If the proposed solution of the community did not work, do not just say “it didn’t work”. Include the new error message that you get and post your updated code.
-
Accept the answer by clicking on the checkbox if you found a solution. This helps others recognize that the problem was “solved”.
-
Pay it forward! Help others with their questions.
Additional Resources:


