Thanks. I tried adding scaleanchor and scaleratio but it’s still not working. It only zooming in one trace. Here is a small example.
var data = [
{
x: [‘2011-08-08’, ‘2011-08-09’, ‘2011-08-10’],
y: [6, 10, -2],
error_y: {
type: ‘data’,
array: [1, 2, 3],
visible: true
},
type: ‘scatter’,
mode: ‘markers’,
name: ‘North’,
hoverinfo: ‘text+x+y’,
yaxis: ‘y3’
},
{
x: [‘2011-08-08’, ‘2011-08-09’, ‘2011-08-10’],
y: [-1, 3, 5],
error_y: {
type: ‘data’,
array: [.7, .8, .9],
visible: true
},
type: ‘scatter’,
mode: ‘markers’,
name: ‘East’,
hoverinfo: ‘text+x+y’,
yaxis: ‘y2’
},
{
x: [‘2011-08-08’, ‘2011-08-09’, ‘2011-08-10’],
y: [2, -4, 6],
error_y: {
type: ‘data’,
array: [.2, .4, .6],
visible: true
},
type: ‘scatter’,
mode: ‘markers’,
name: ‘Up’,
hoverinfo: ‘text+x+y’,
yaxis: ‘y’
}
];
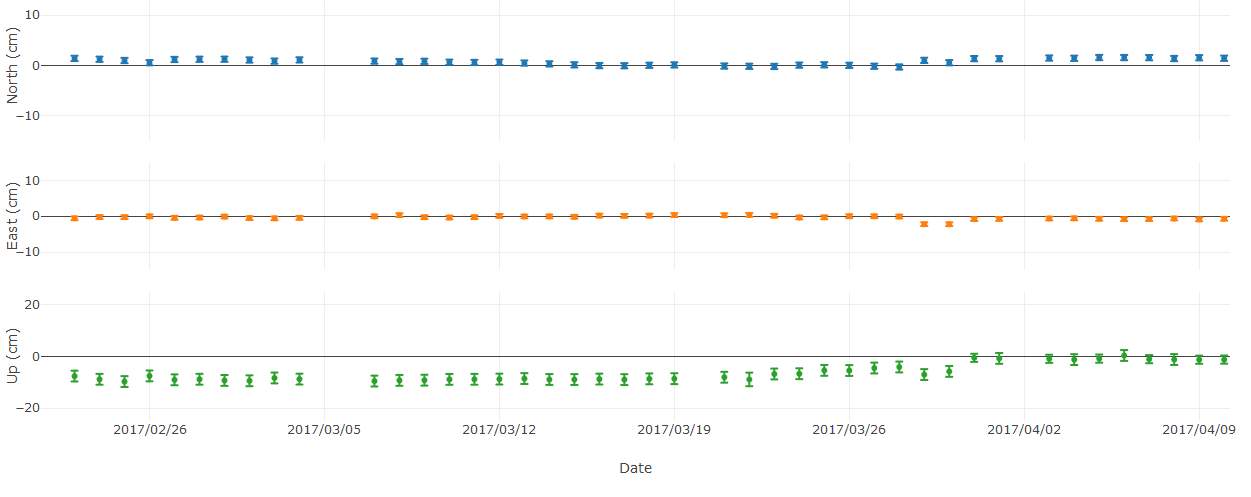
var layout = {
xaxis: {title: ‘Date’, tickformat: ‘%Y/%m/%d’},
yaxis: {
domain: [0, 0.30],
title: ‘Up (cm)’,
scaleanchor: ‘x’,
scaleratio: 0.5
},
yaxis2: {
domain: [0.35, 0.60],
title: ‘East (cm)’,
scaleanchor: ‘x’,
scaleratio: 0.5
},
yaxis3: {
domain: [0.65, 1.0],
title: ‘North (cm)’,
scaleanchor: ‘x’,
scaleratio: 0.5
},
margin: {// update the left, bottom, right, top margin
l: 40, b: 80, r: 10, t: 30
},
hovermode: ‘closest’,
title: ‘Change NEU’
};
Plotly.newPlot('myDiv', data, layout);