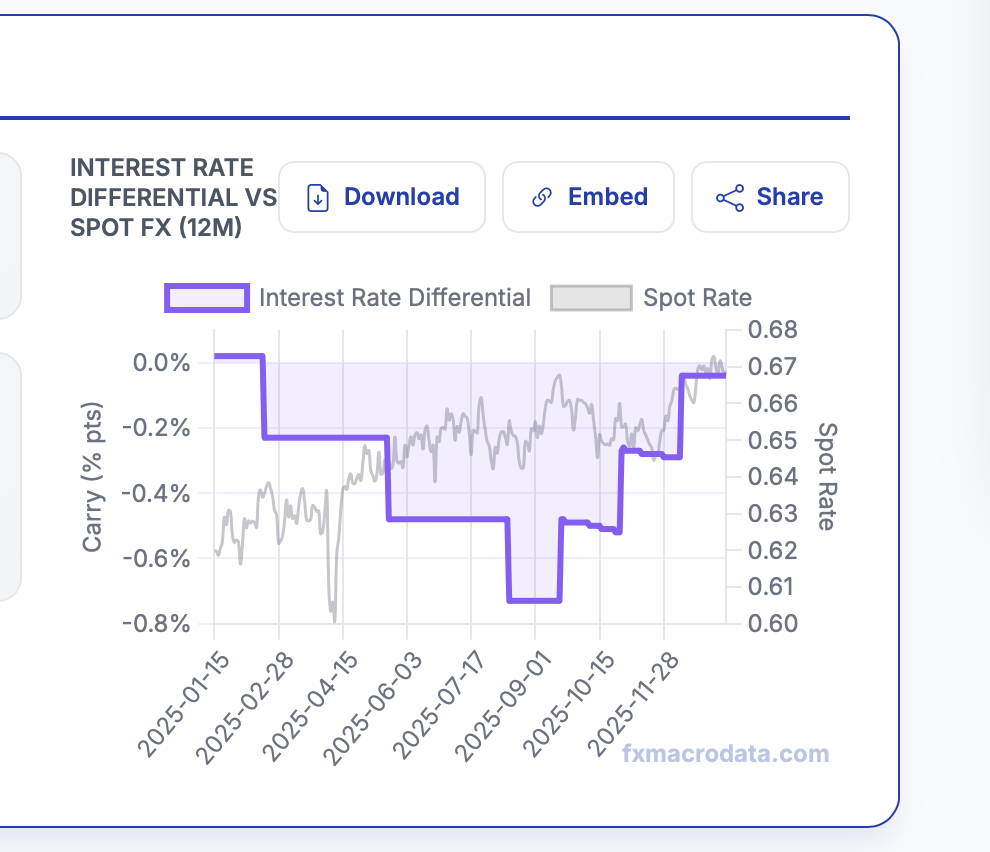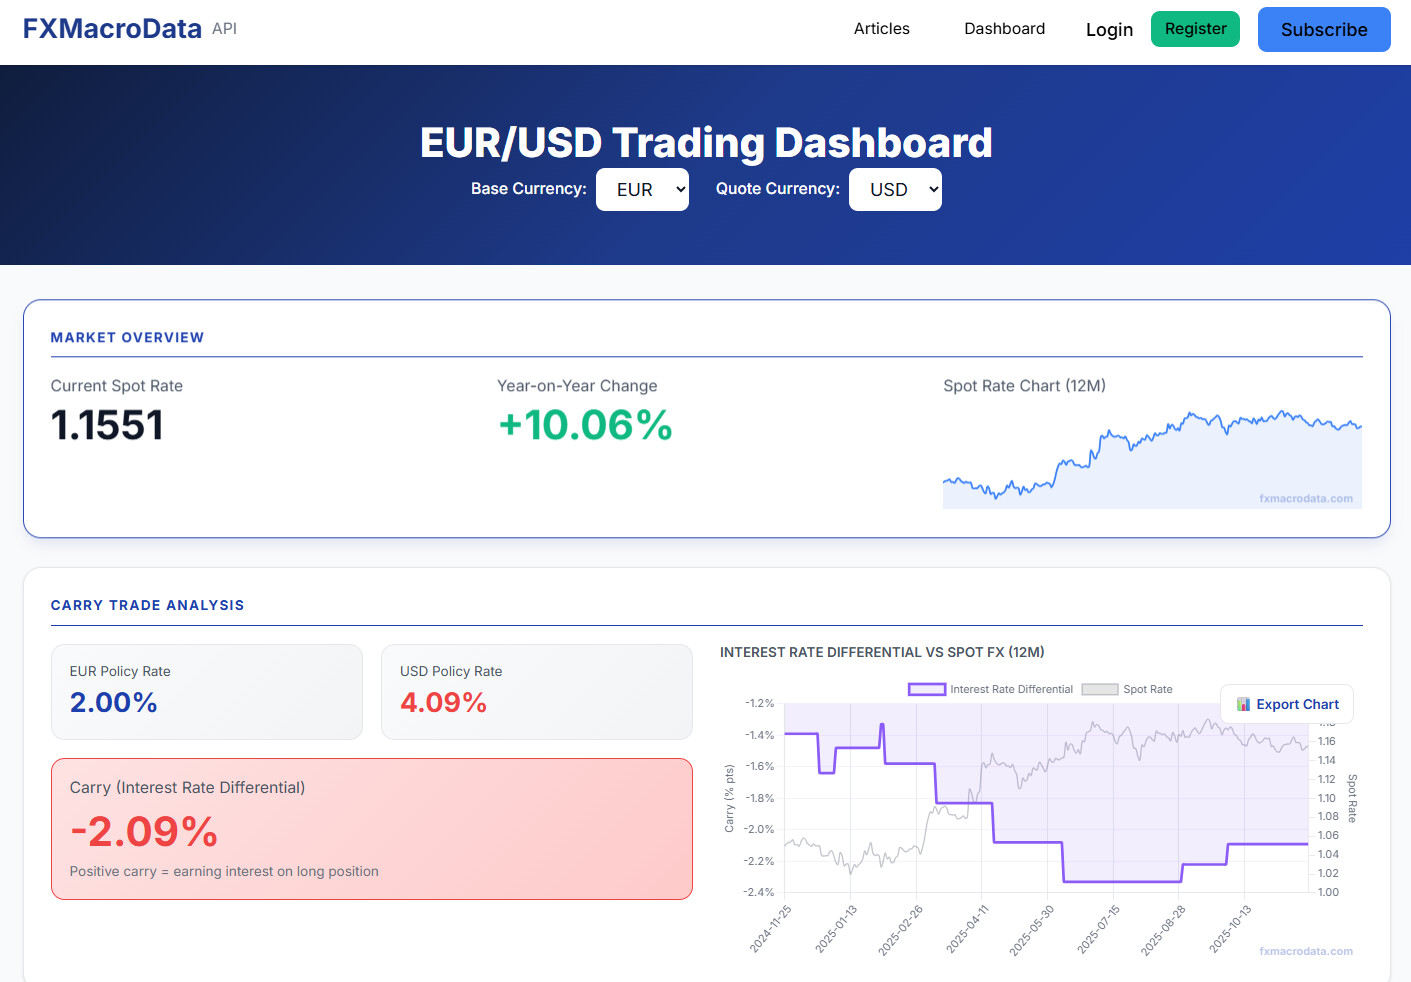
I have created a dashboard with plotly.js: https://fxmacrodata.com/dashboard/EUR_USD. The dashboard has a real-time connection to central bank announcements (inflation, interest rates etc) and compares the macroeconomic data for two different countries with an overlay of the daily forex price so that the impact of economic announcements on forex prices can be assessed.
The currencies to be compared can be toggled at the top or changed through the url parameters (like EUR/USD in the example). Data can be accessed through the python library: https://github.com/fxmacrodata/fxmacrodata
Please let me know what you think.