Explore new releases, Dash MCP updates, FIFA World Cup Challenge winners, FastAPI and Quart integrations, and more.
Plotly Studio and Dash Highlights
Below you will find remarkable data apps built by the community and Plotly staff members with Plotly Studio and Dash.
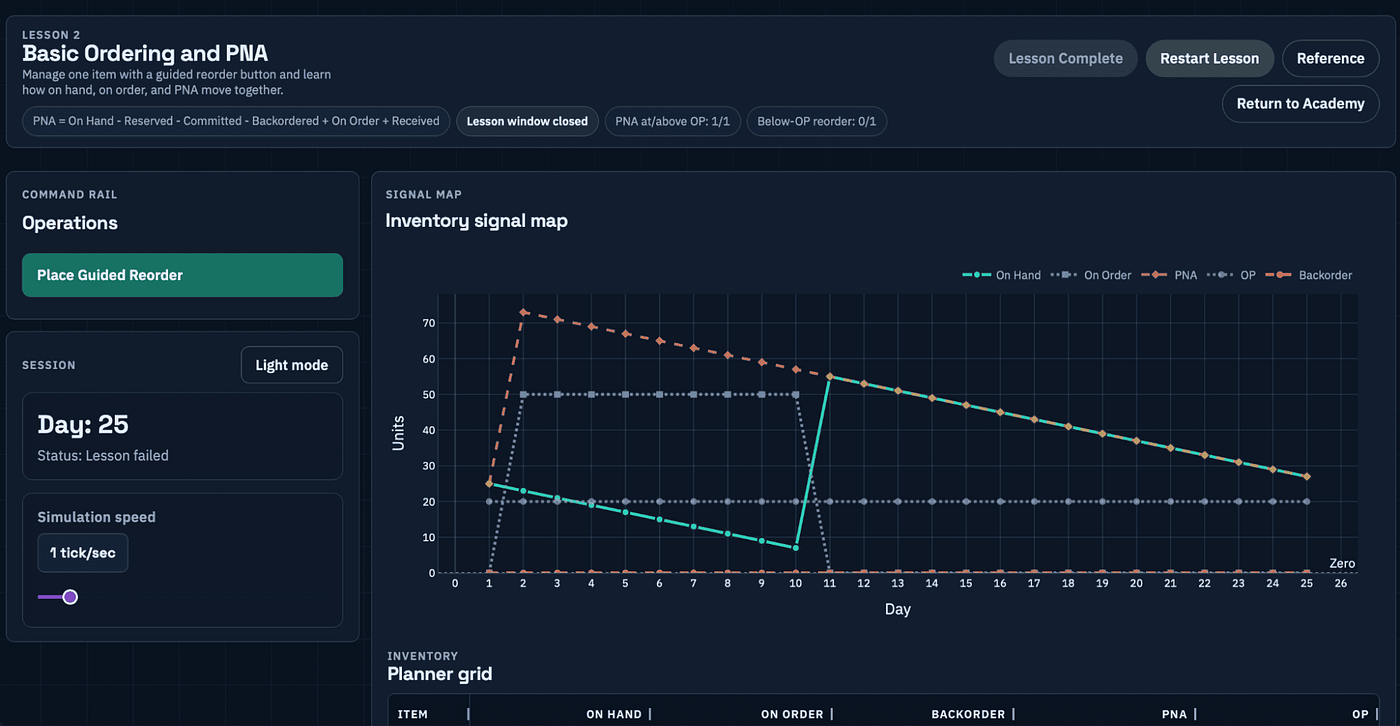
 IMSim Academy is a Dash-based inventory management training and simulation app. It teaches replenishment concepts step by step through a lesson path, which unlocks a full simulator where users can practice inventory decisions and see live feedback. GitHub repo.
Thank you community member, SchmidtCode, for submitting it to the Plotly Examples page.
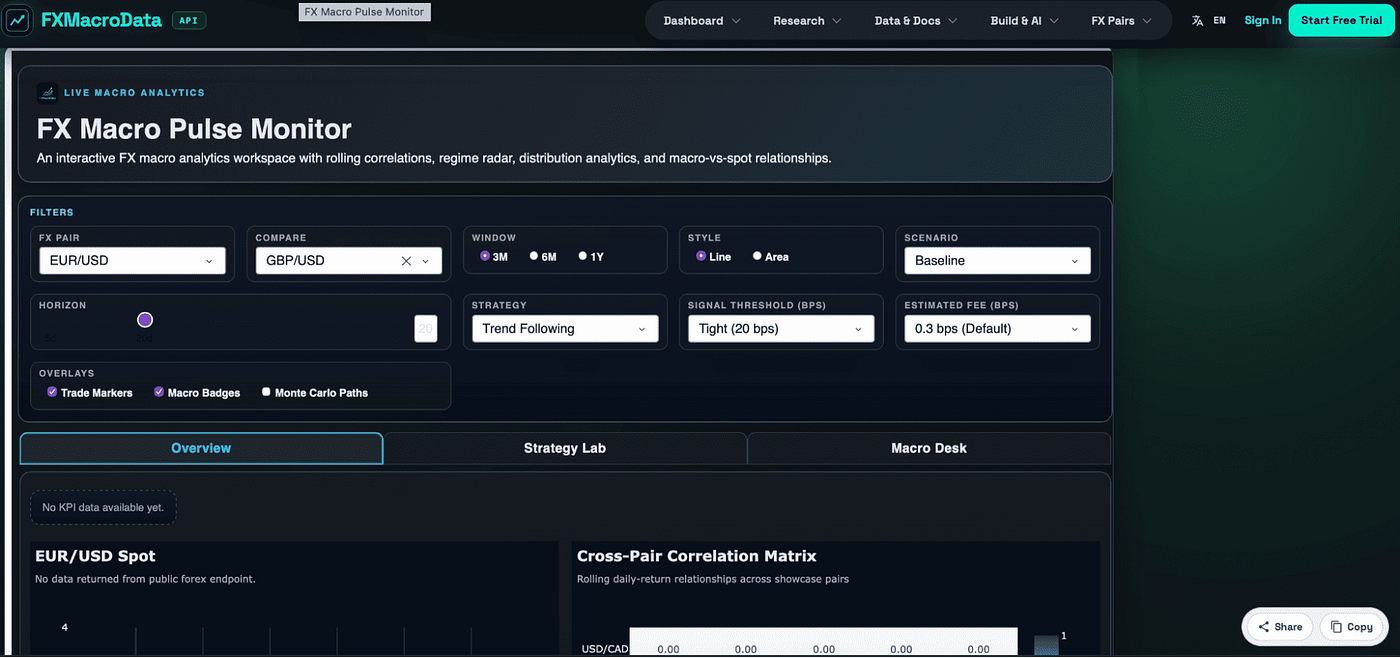
FXMacroData Public Macro Monitor is a live Dash app for exploring FX-relevant macroeconomic data across currencies, central banks, and market sessions. It helps users quickly compare indicators, spot trends, and understand how macro conditions differ across countries in a clean, practical, and publicly accessible interface.
Thank you Robert for sharing this app.
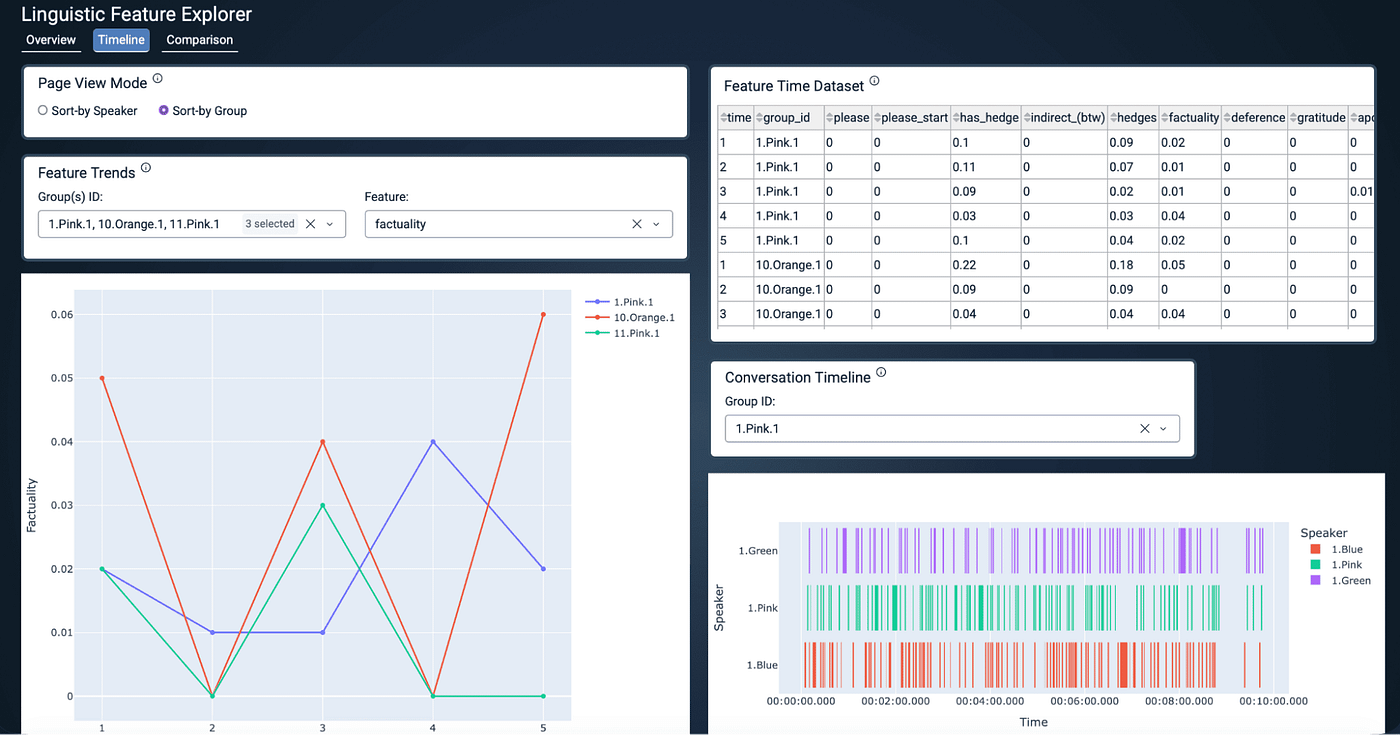
Corpus Analyzer is an interactive dashboard for exploring conversational dynamics and linguistic features. Corpus Analyzer cleans, pre-processes, and extracts conversational features using the ConvoKit toolkit and other feature-extraction strategies.
Thank you Ziana for building this app.
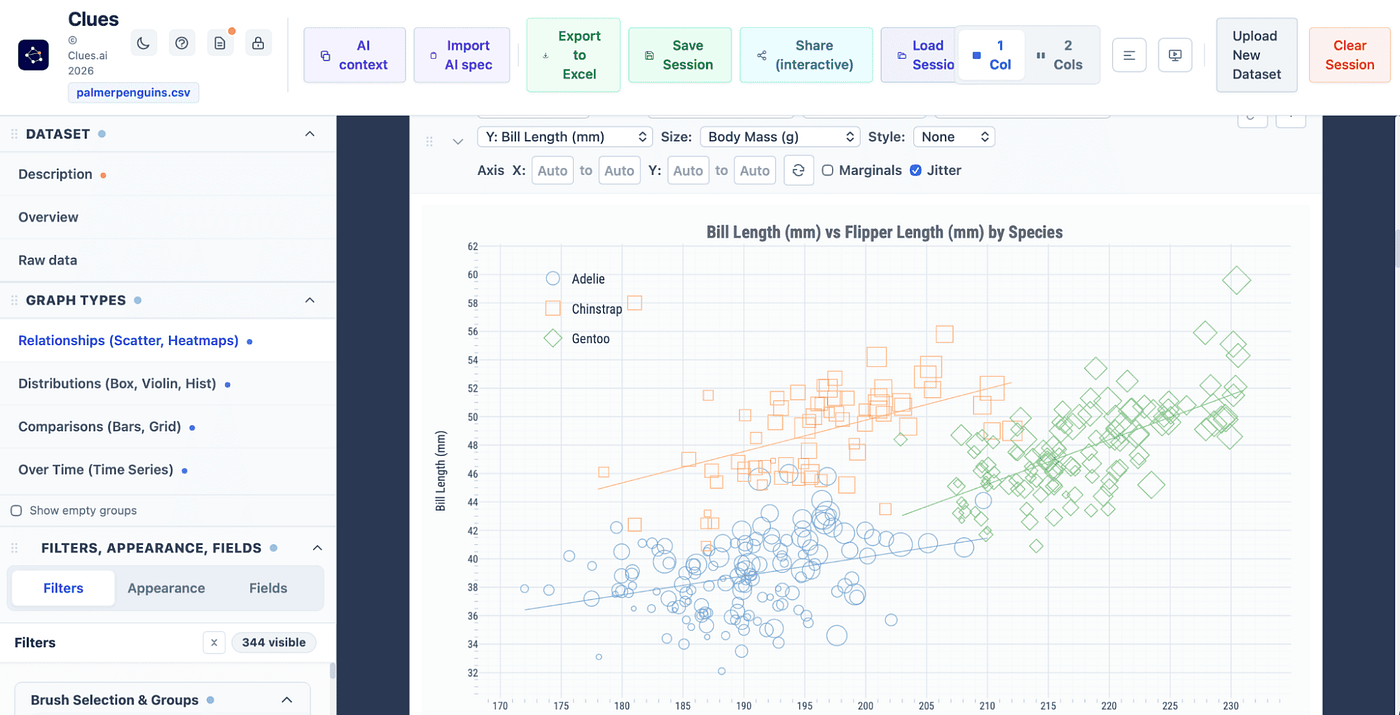
Last but not least, an app built on top of Plotly.JS. Clues is a data viz tool for non-coders: people who have a CSV and a few questions but won’t touch code. It’s a single HTML file, all client-side, so nothing leaves the browser. See the GitHub repo.
Thank you to community member, MMAX, for sharing this app.
 Thank you everyone for creating these apps and submitting them to the Plotly Examples Page.
See more Dash and Plotly Studio apps or share your own in the community forum’s Show and Tell tag. If you would like your app to be considered for the next edition of the Dash Club newsletter or the Dash Explore Page, please submit it by clicking the Share Your App button.
Upcoming Webinar
Learn about Stanford STEER’s Dash-powered battery design platform: OpenCell. Led by Dr. Nicholas Siemons, Software and Battery Lead, the webinar will cover how to:
- Turn complex datasets and physics models into tools that inform design decisions
- Extend insights beyond dashboards with automated reports and shareable outputs
- Deliver tailored experiences for end users with authentication and permission sets
FIFA World Cup Plotly Challenge Winners
Thank you to all the community members that participated in the FIFA Plotly App Challenge. It was a pleasure witnessing the amazing apps that the community built.
After reviewing all the submissions, the Plotly judging committee has selected the top 3,  …
…
 1st place goes to Shail for the Statdium app (see GitHub repo). Shail’s app centralizes all our World Cup needs for information in one place: the upcoming games, the history of qualifications per country, a leaderboard for goal scorers, a fan pulse map, and even a list of hosting stadiums.
In addition, this app scores 10 over 10 for cleanliness and a professional look. Most UI elements even work perfectly on mobile, something which many of the other apps did not offer.
On a side note: running a Monte Carlo simulation on Canada winning the championship and seeing 0% was tough  .
.
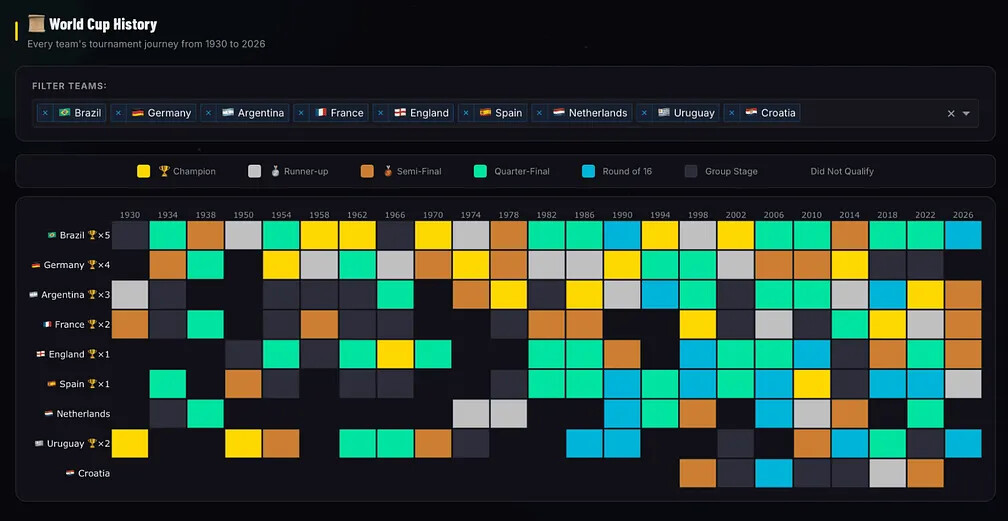
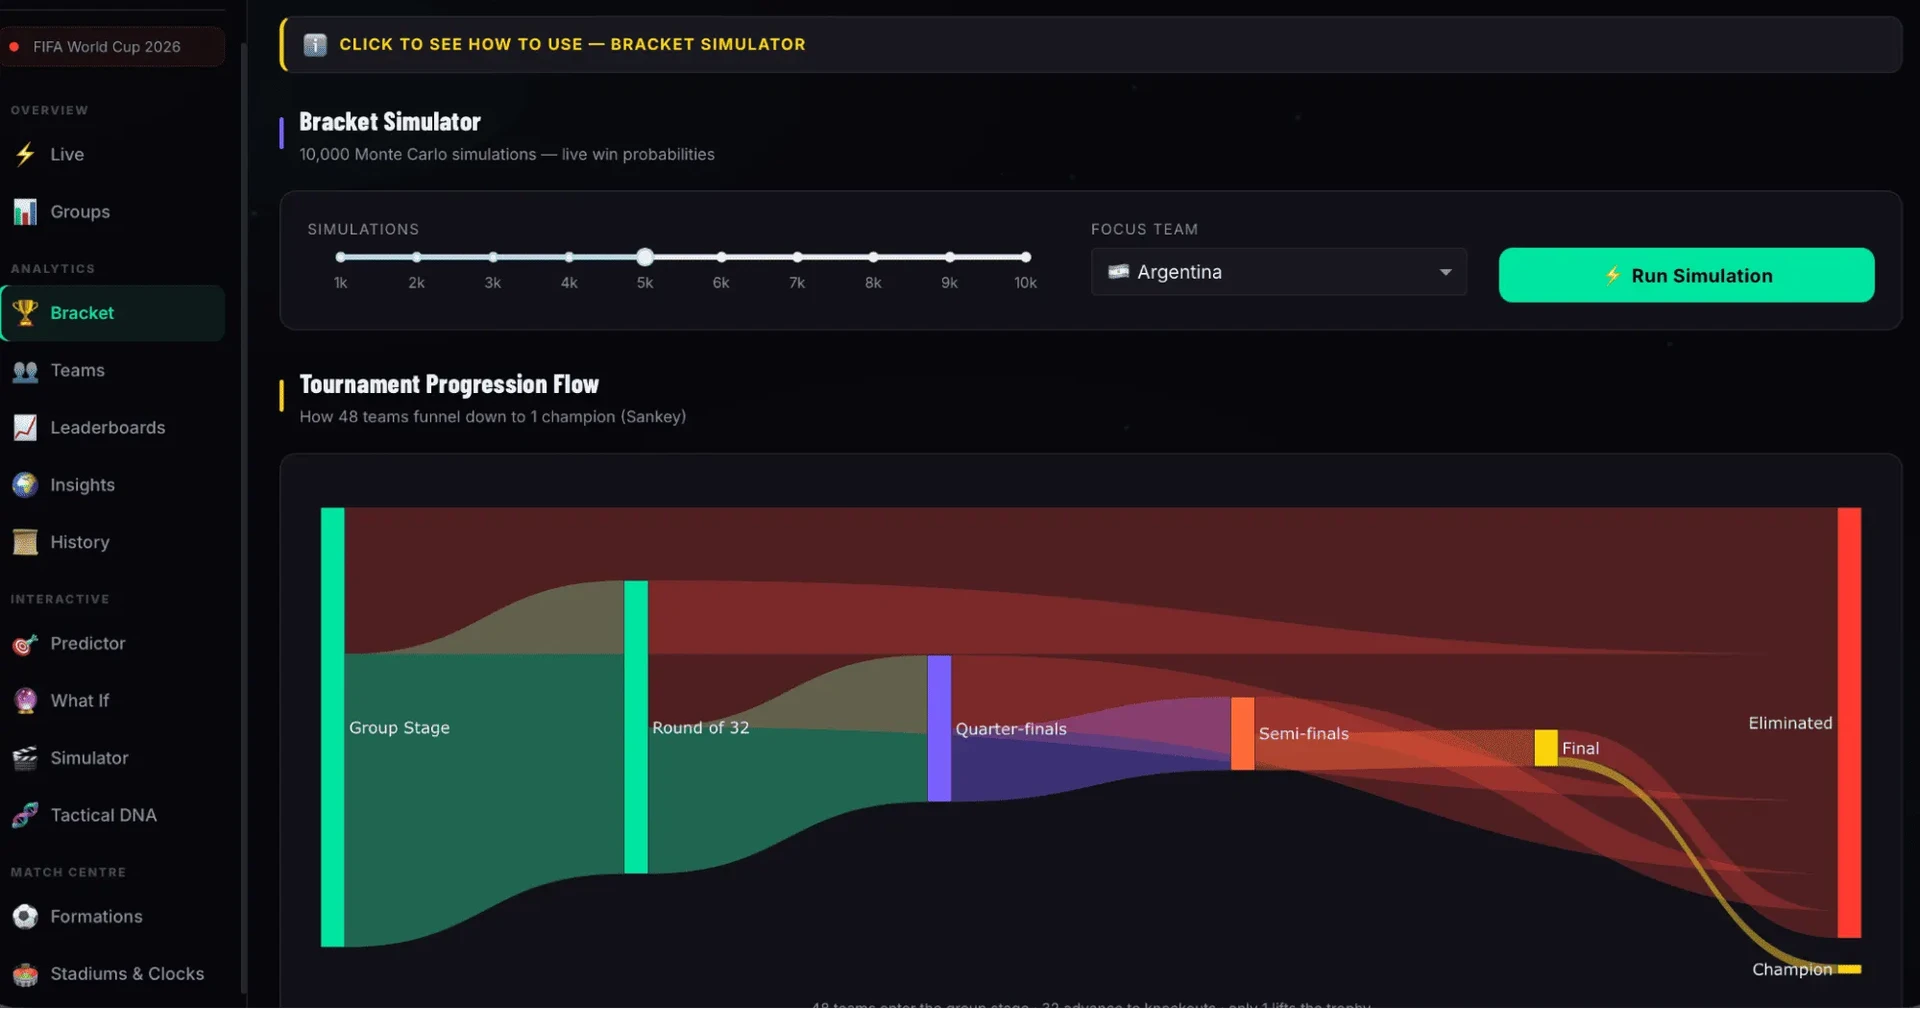
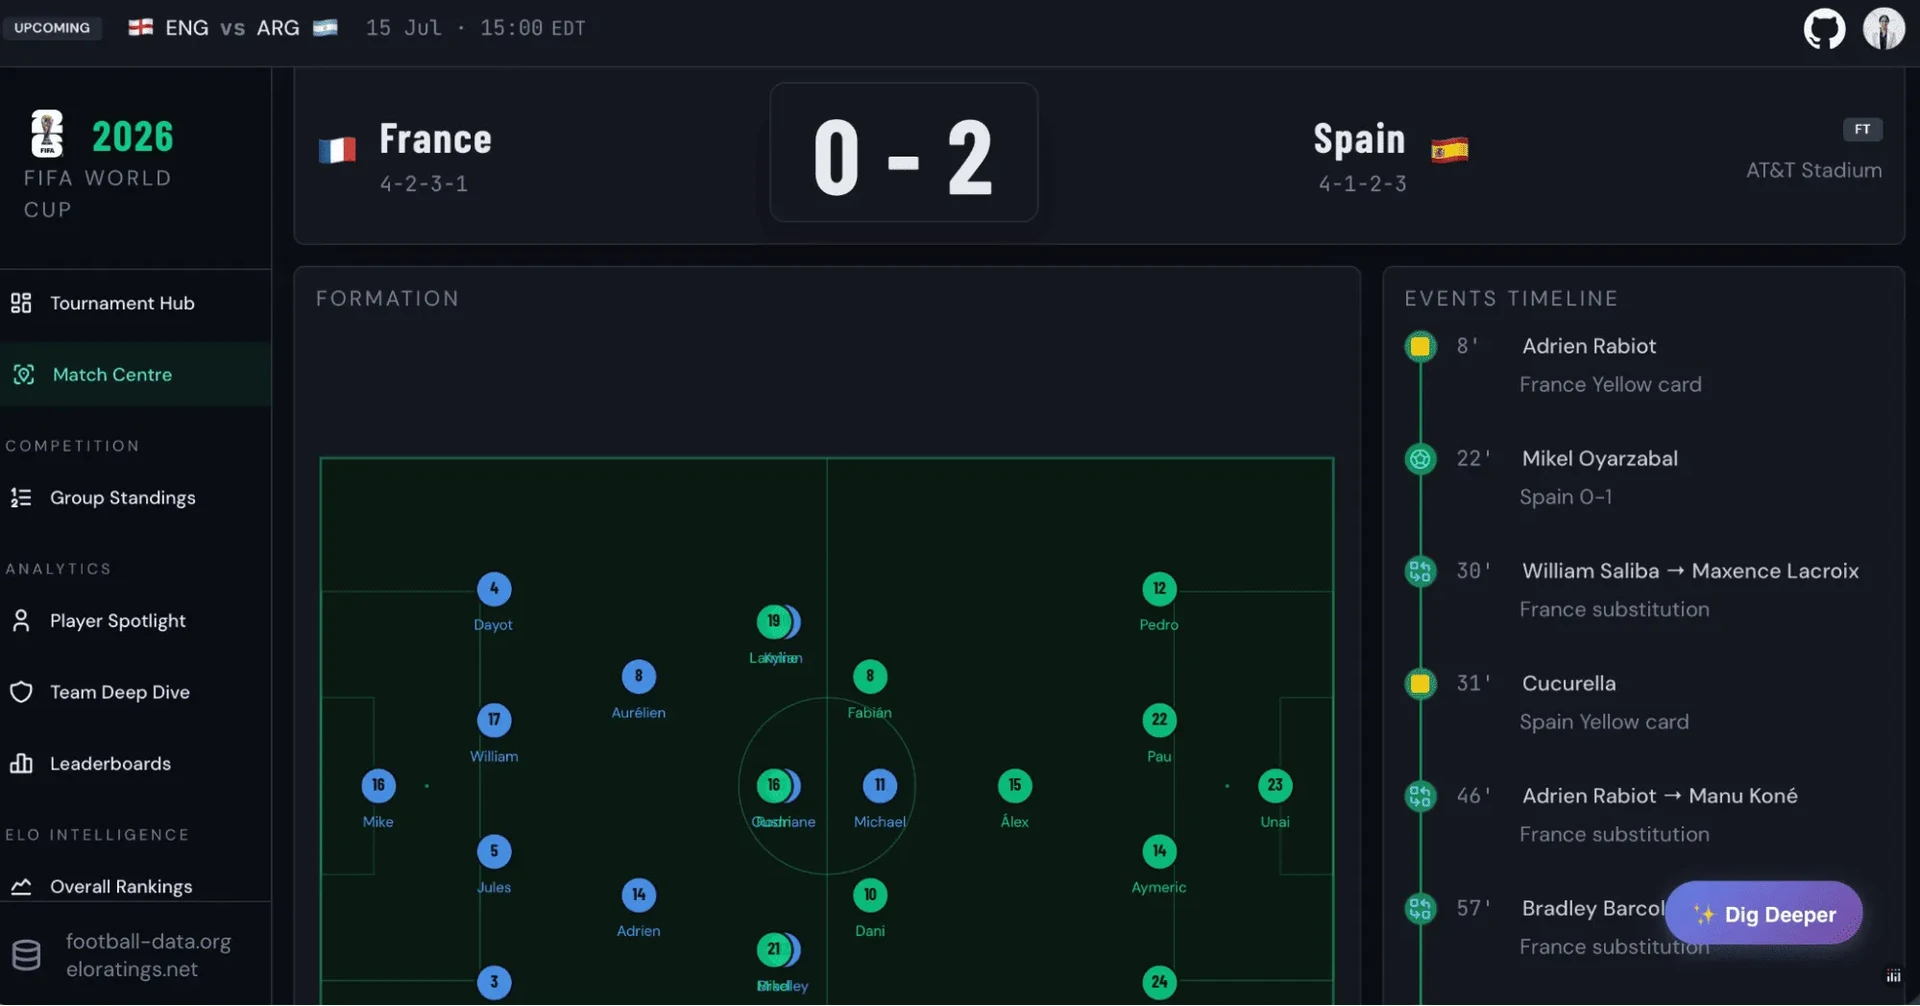
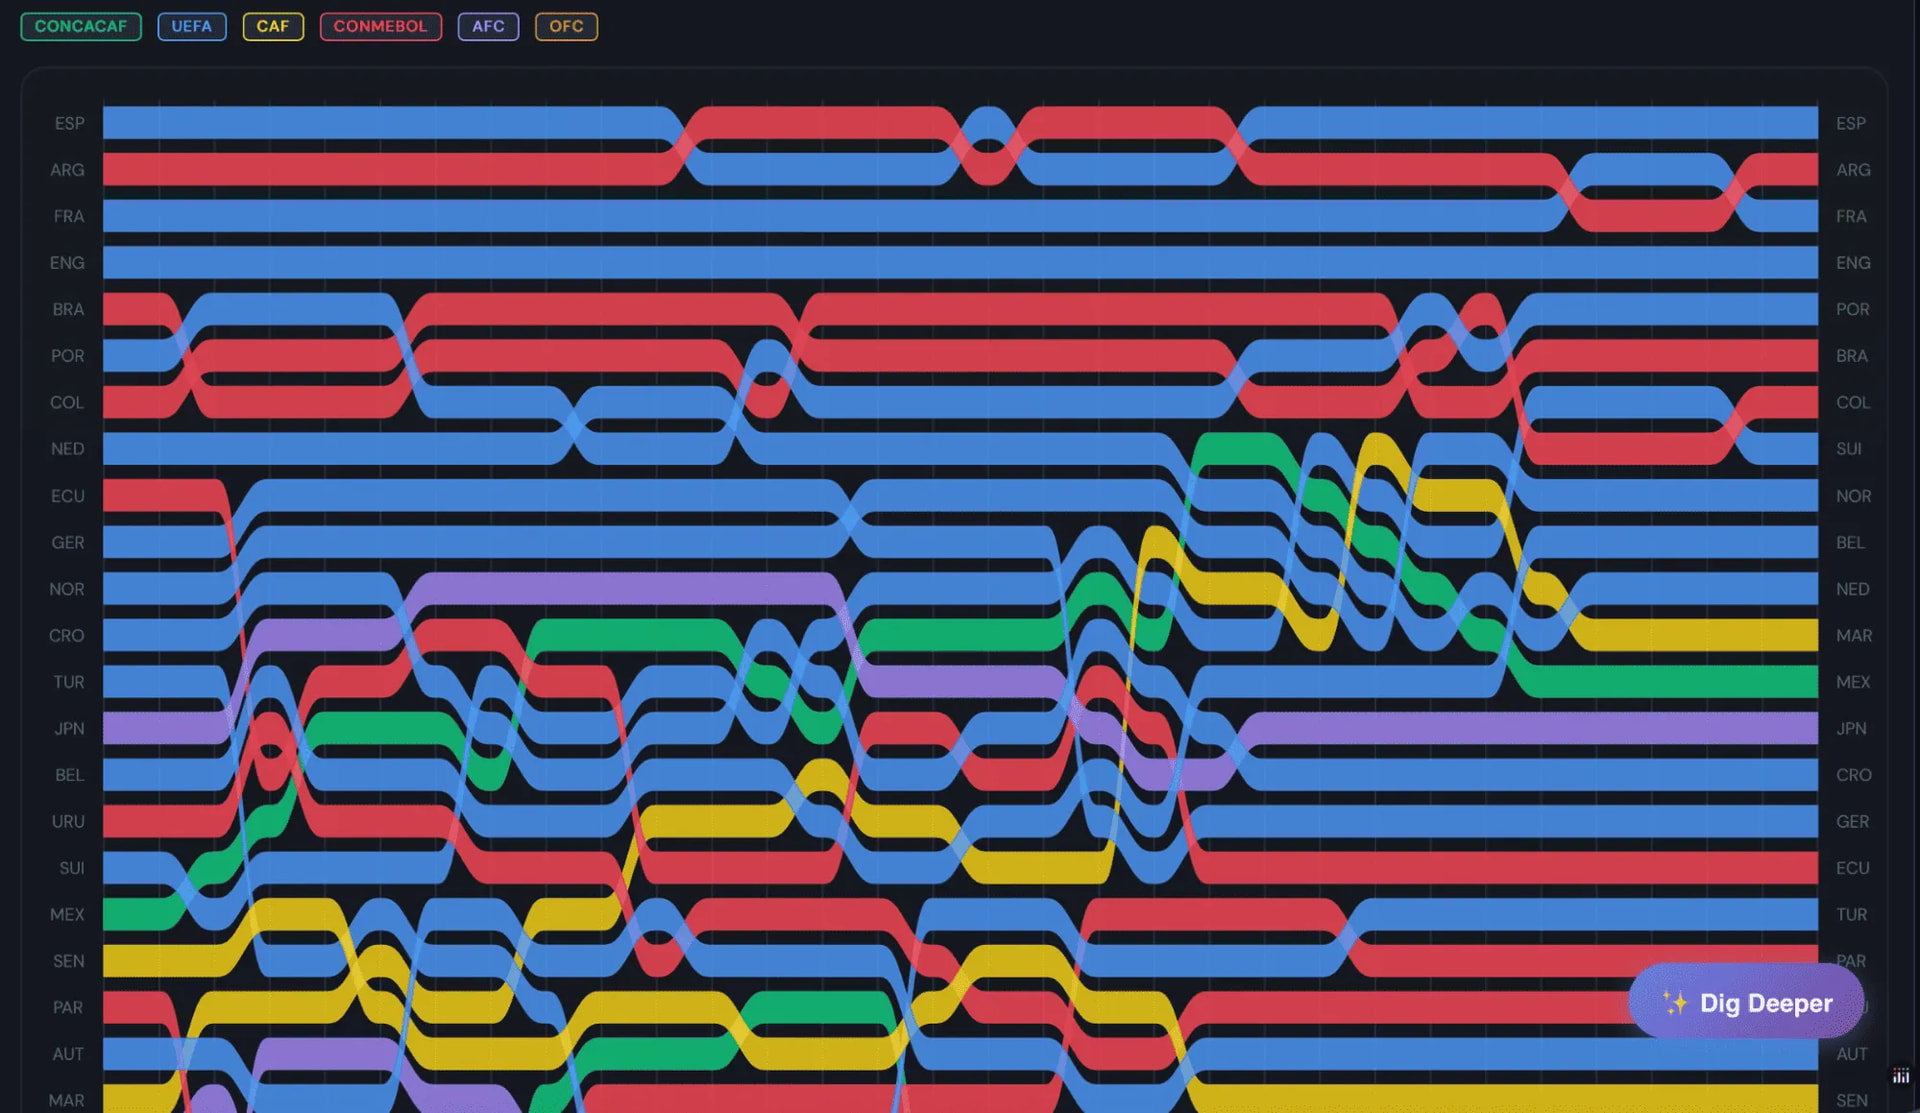
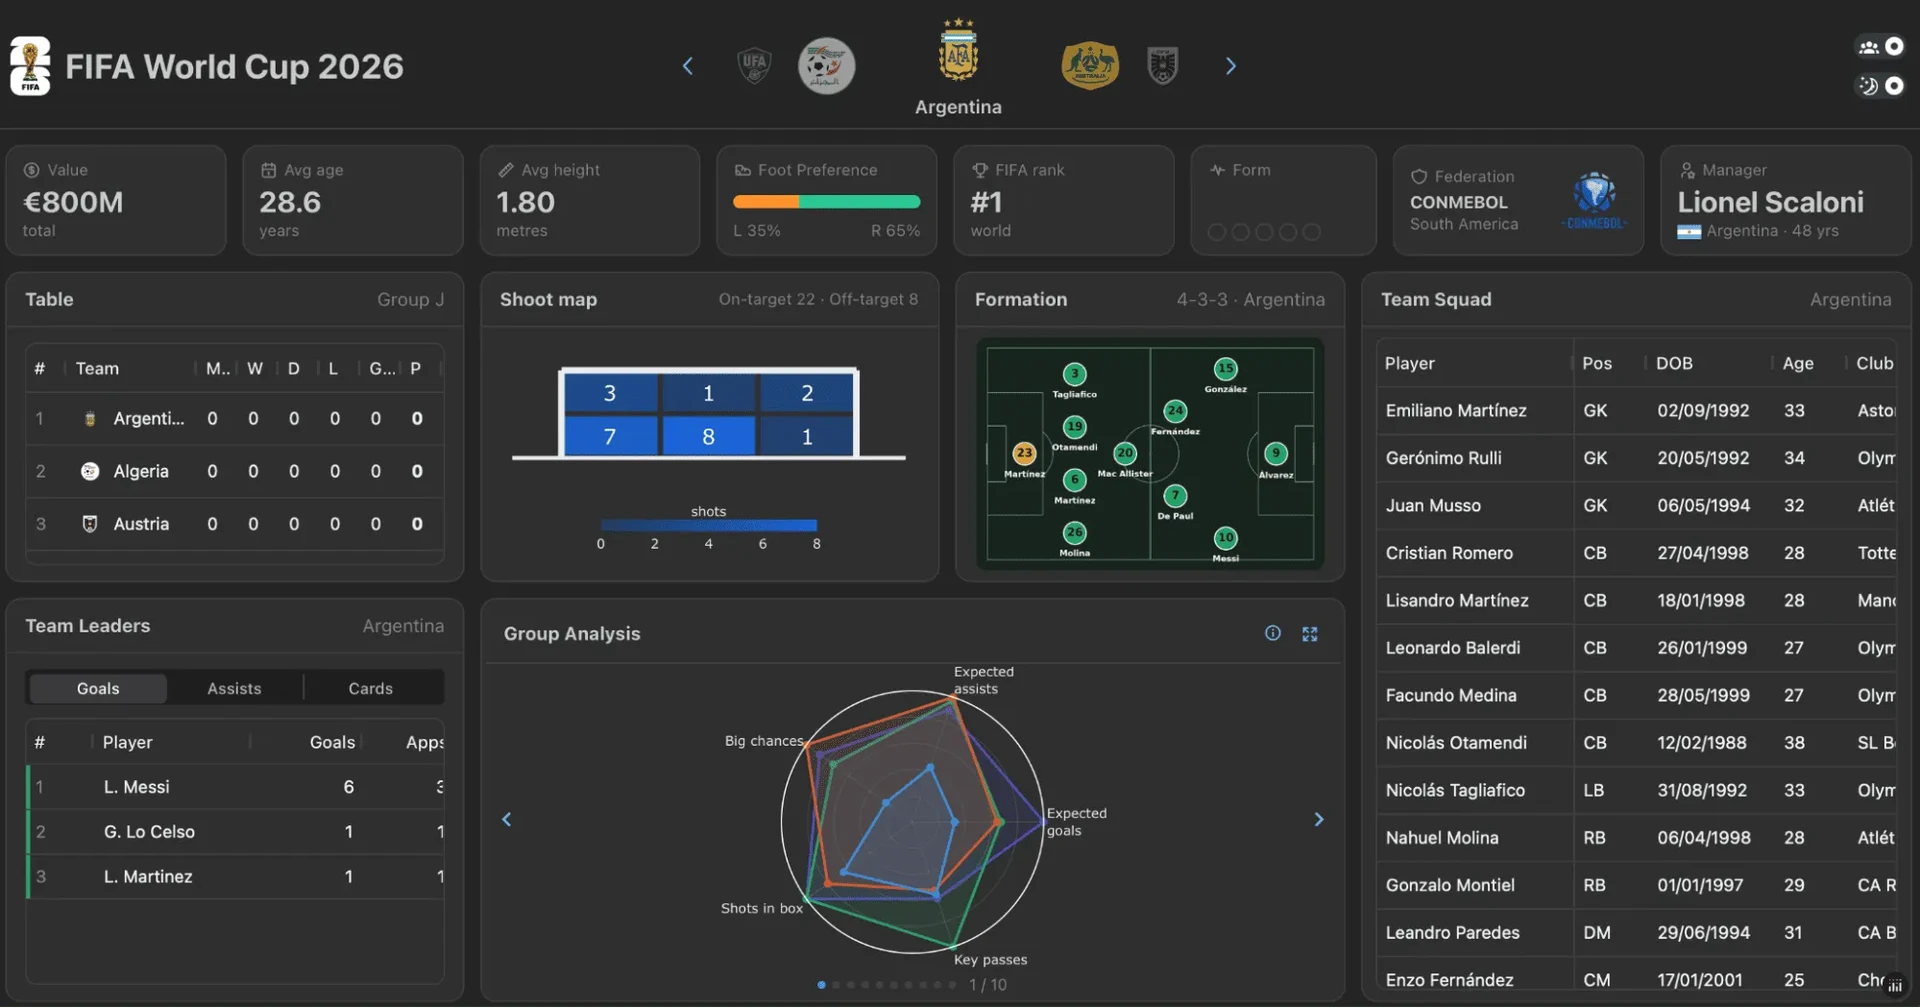
 2nd place goes to Deepa for the FIFA Plotly Dash app (see GitHub repo).This application has a great balance of rich data while not overwhelming the viewer. The dynamic header, with the most important information, is great to have since it summarizes what’s essential for the user to know! The ELO ranking change is a fantastic graphic, and the match replay feature is a strong addition because it gives a quick history of the game.
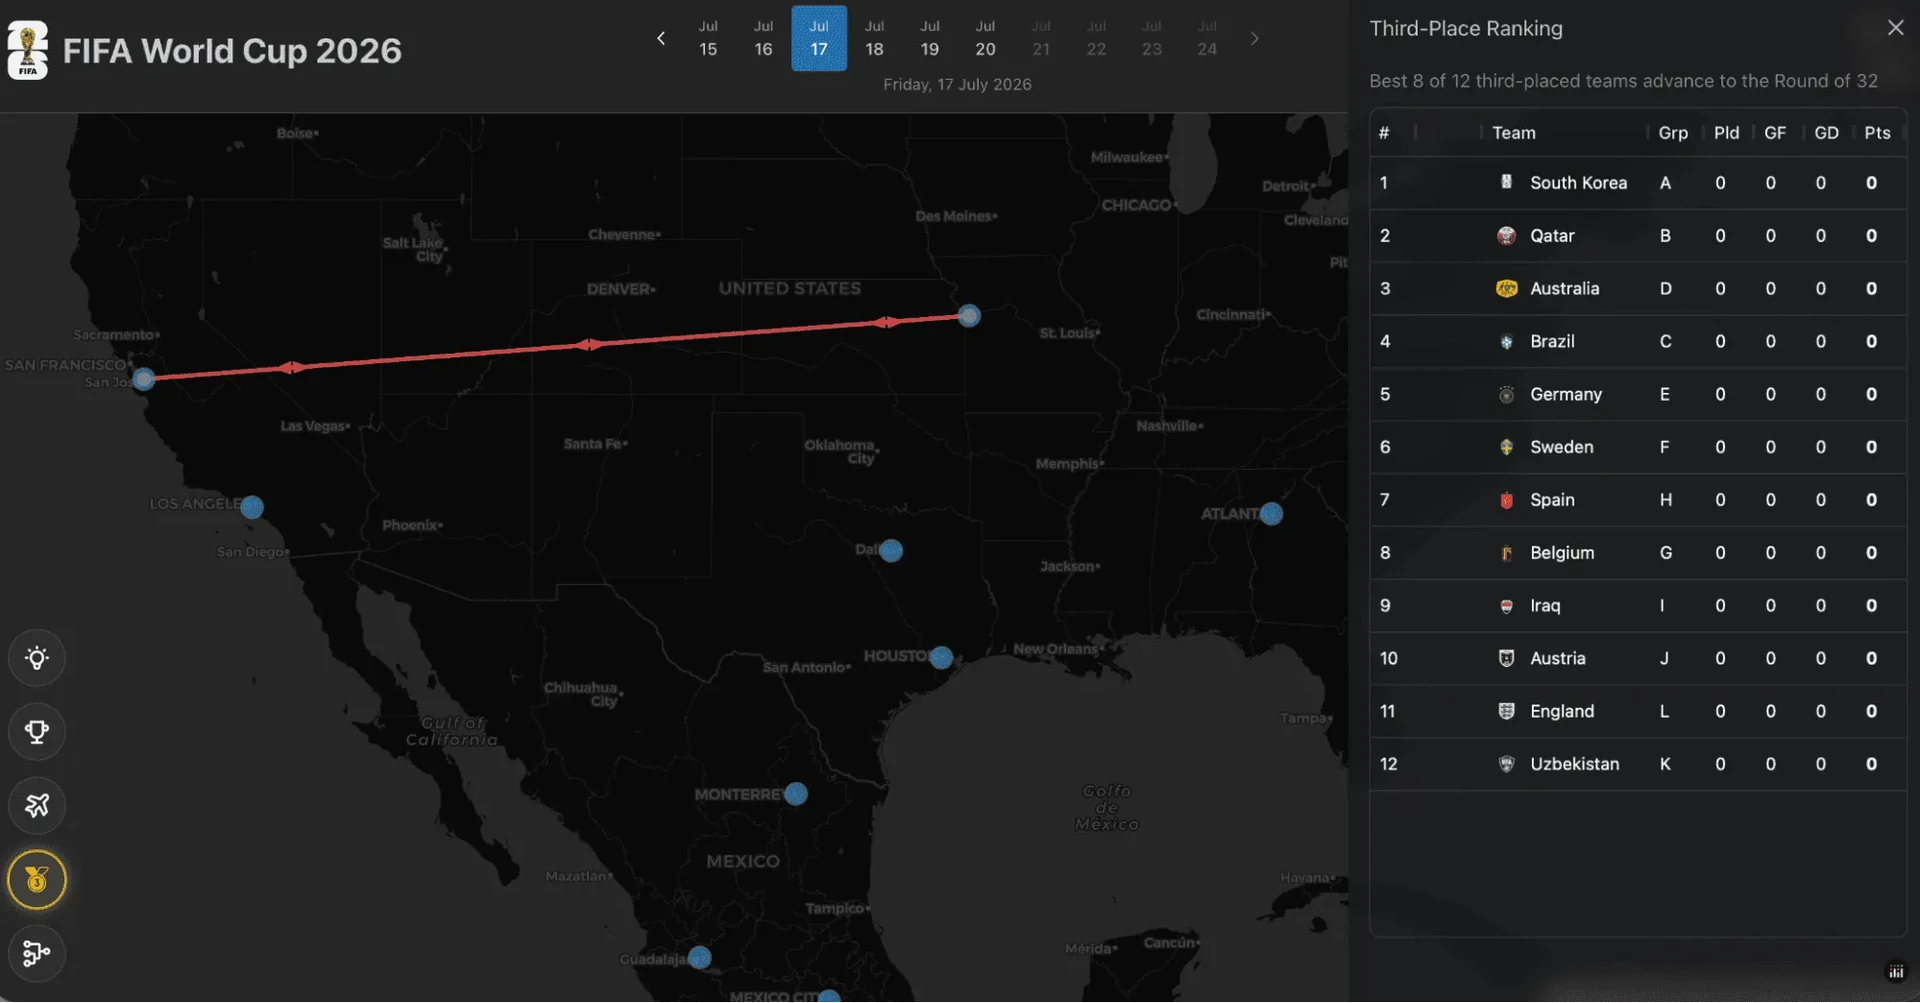
 3rd place goes to Yigitalp for the following FIFA Plotly Dash app (see GitHub repo). The app has very good visual clarity despite being information dense. We loved the unique travel planner and the highlighting of the active stadiums/scores on various dates.
The travel map is a unique feature that we didn’t see in other entries. That said, it has a fixed zoom that makes it difficult to map travel, since it’s not possible to zoom out to see all host cities.
Congratulations to our winners and thank you again to all the community members who participated in this challenge.
FastAPI and Quart
Several weeks ago, Plotly officially released Dash 4.2, introducing first-class support for FastAPI and Quart as server backends alongside the traditional Flask default.
By simply updating the backend parameter in the Dash constructor, developers can seamlessly integrate Dash apps into existing enterprise services, eliminating the need for complex reverse proxies.
This highly requested update unlocks robust native asynchronous capabilities, enabling developers to build async callbacks, share API endpoints, and leverage newly introduced WebSocket callbacks for real-time, server-pushed UI updates.
Read the blog post for more info!
Dash MCP
With Dash 4.3 you can turn your Dash app into the source of truth for LLMs.
Simply transform your app into a Model Context Protocol (MCP) server with a single line of code:
app = Dash(__name__, enable_mcp=True)
With this new capability, AI agents like Claude and ChatGPT can go into your app directly to fetch real, live data instead of making a guess.
Read the blog post for more info!
Plotly 6.7 + Dash 4.4: Click & Hover Anywhere
The Plotly team has introduced a highly requested interactivity feature in our latest releases, allowing dcc.Graph components to capture click and hover events anywhere within a plotting area, even over blank space.
By enabling clickanywhere=True or hoveranywhere=True in the figure layout, applications unlock new event data payloads featuring exact graph coordinates (xvals, yvals) and specific axis identifiers (xaxes_id, yaxes_id).
This functionality opens the door for building advanced user experiences like custom drawing tools, measurement rulers, map pin placement, and multi-subplot targeting.
Read more and see examples in community member Ann Marie’s forum post!
Version Check
- Dash Enterprise Platform 6.2.0 (docs)
- Dash Open Source Framework 4.4.0 (changelog)
- Dash AG Grid 35.3.0 (changelog)
- Plotly.py 6.9.0 (changelog)
- Plotly.js 3.7.0 (changelog)
Have a great rest of your week!