The code
import pandas as pd
import plotly.graph_objects as go
import dash
from dash import dcc, html
from dash.dependencies import Input, Output, State, ALL
import dash_bootstrap_components as dbc
=================================================================
1. DATA (Updated with Weight and Yield)
=================================================================
def load_data():
FRUIT_PATH = ‘fruits.csv’
VEG_PATH = ‘vegetables.csv’
try:
    df_fruit = pd.read_csv(FRUIT_PATH)
    df_veg = pd.read_csv(VEG_PATH)

    # Column mapping
    cols_map = {
        'Fruit': 'Item',
        'CupEquivalentPrice': 'Price',
        'Form': 'Form',
        'Yield': 'Yield'
    }

    df_fruit.rename(columns=cols_map, inplace=True)
    df_veg.rename(columns={'Vegetable': 'Item', 'CupEquivalentPrice': 'Price',
                           'Form': 'Form', 'Yield': 'Yield'}, inplace=True)

    df_fruit['Category'] = 'Fruit'
    df_veg['Category'] = 'Vegetable'

    df = pd.concat([df_fruit, df_veg], ignore_index=True)

    # If CupWeight column does not exist in CSV, use 0.33 lbs (approx 150g) as generic average
    if 'CupWeight' not in df.columns:
        df['CupWeight'] = 0.33

    df.dropna(subset=['Price'], inplace=True)

except:
    # Improved Demo data with real Yields and Weights (Lbs/Cup)
    data = {
        'Item': ['Apples', 'Apples', 'Bananas', 'Oranges', 'Strawberries', 'Strawberries',
                'Grapes', 'Watermelon', 'Pineapple', 'Blueberries',
                'Spinach', 'Spinach', 'Carrots', 'Broccoli', 'Tomatoes',
                'Lettuce', 'Peppers', 'Cucumber', 'Kale', 'Cauliflower'],
        'Price': [0.50, 0.30, 0.30, 0.45, 0.85, 0.60,
                 0.70, 0.38, 0.52, 0.95,
                 0.40, 0.35, 0.25, 0.55, 0.60,
                 0.28, 0.48, 0.32, 0.42, 0.58],
        'Category': ['Fruit']*10 + ['Vegetable']*10,
        'Form': ['Fresh', 'Juice', 'Fresh', 'Fresh', 'Fresh', 'Frozen',
                'Fresh', 'Fresh', 'Fresh', 'Fresh',
                'Fresh', 'Frozen', 'Fresh', 'Fresh', 'Fresh',
                'Fresh', 'Fresh', 'Fresh', 'Fresh', 'Fresh'],
        # Yield: % Edible (e.g., Banana 0.64 means 36% is peel)
        'Yield': [0.90, 1.0, 0.64, 0.72, 0.92, 0.94,
                 0.96, 0.52, 0.51, 0.94,
                 0.93, 1.0, 0.97, 0.89, 0.91,
                 0.94, 0.87, 0.95, 0.91, 0.88],
        # CupWeight: How much 1 cup weighs in Pounds (lbs)
        'CupWeight': [0.24, 0.5, 0.33, 0.37, 0.33, 0.33,
                     0.35, 0.34, 0.36, 0.32,
                     0.15, 0.30, 0.28, 0.20, 0.37,
                     0.12, 0.30, 0.30, 0.15, 0.22]
    }
    df = pd.DataFrame(data)

return df
df = load_data()
Create unique list of base products (without form)
unique_items = sorted(df[‘Item’].unique())
Reference to the CSS file for custom styles
Changed Bootstrap theme to FLATLY for a cleaner, modern/minimalist look
EXTERNAL_STYLESHEETS = [dbc.themes.FLATLY, ‘/assets/styles.css’]
=================================================================
2. APP UI (Optimized Layout with Accordion and Fixed Scroll)
=================================================================
Dash is initialized with external styles, including the custom CSS
app = dash.Dash(name, external_stylesheets=EXTERNAL_STYLESHEETS)
app.title = “Cost Analysis of Fruits and Vegetables”
Component 1: Household Configuration
config_card = dbc.CardBody([
html.H5(“ Household Configuration”, className=“mb-3”),
dbc.Row([
dbc.Col([
html.Label(“People in household:”, className=“fw-bold”),
dcc.Slider(
id=‘people’,
min=1, max=8, step=1, value=4,
marks={i: str(i) for i in range(1, 9)},
tooltip={“placement”: “bottom”, “always_visible”: True}
)
], md=12)
]),
html.Div(id=‘usda-recommendation’, className=“mt-3 text-center text-muted”)
])
Component 2: Product Selector
selector_card = dbc.CardBody([
html.H5(“ Select the items you actually buy”, className=“mb-3”),
dcc.Dropdown(
id=‘product-selector’,
options=[{‘label’: item, ‘value’: item} for item in unique_items],
multi=True,
placeholder=“Search and select products…”,
value=[‘Apples’, ‘Bananas’, ‘Carrots’, ‘Broccoli’, ‘Watermelon’]
),
# Input container with fixed scrollbar
html.Div(
id=‘product-inputs’,
className=“mt-4”,
style={‘maxHeight’: ‘400px’, ‘overflowY’: ‘scroll’, ‘paddingRight’: ‘15px’}
)
])
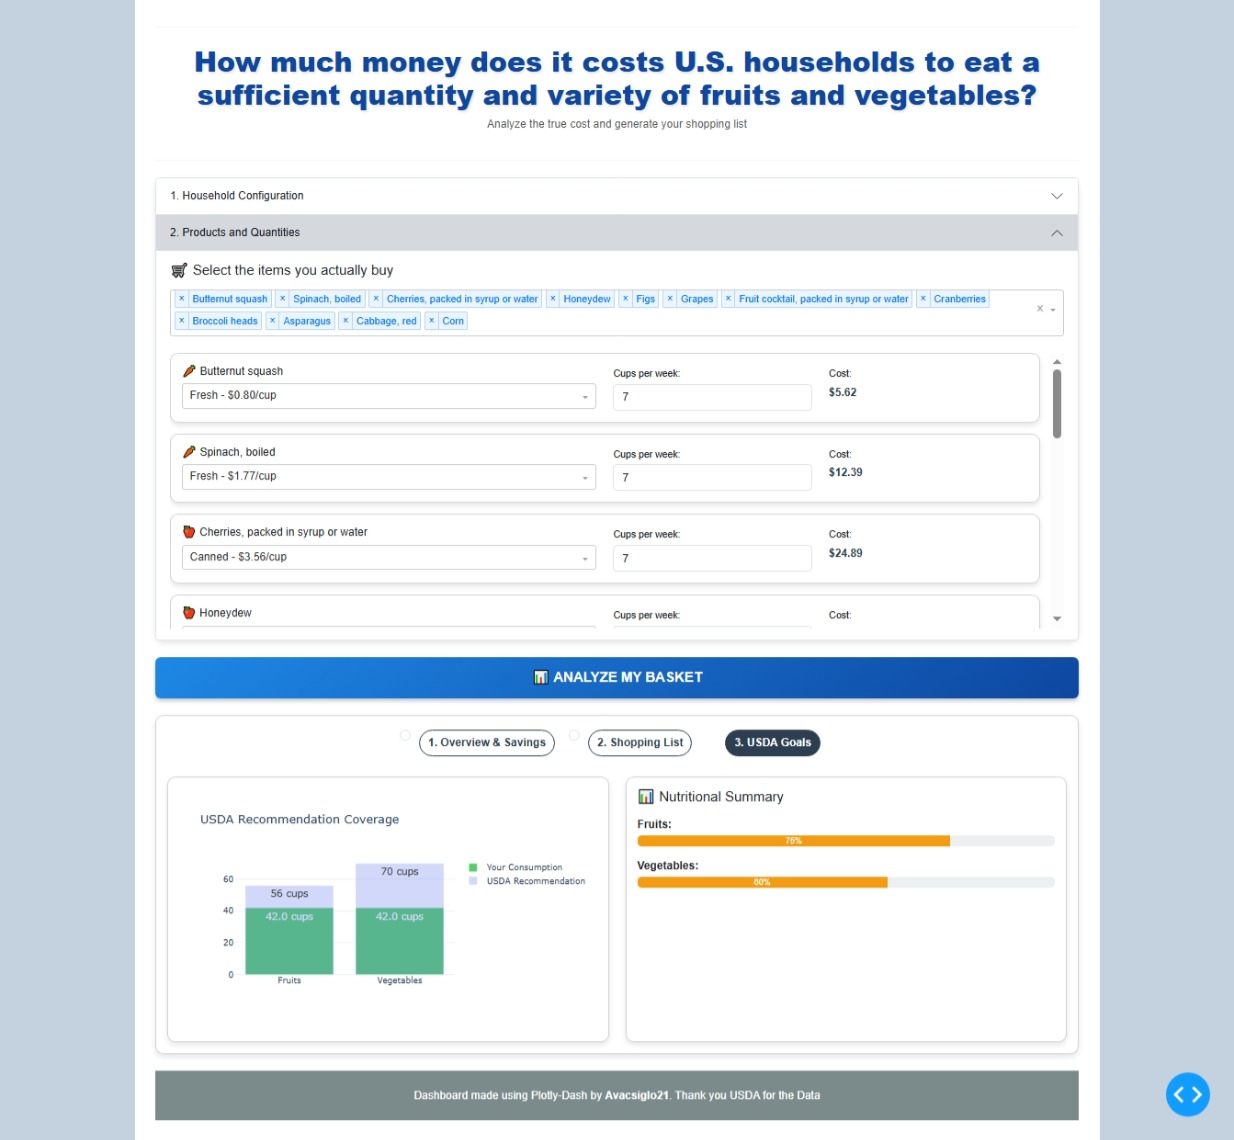
app.layout = dbc.Container([
# Header
# Styling the HR line
html.Hr(style={'margin-top': '0.5rem', 'margin-bottom': '0.5rem', 'border-top': '1px solid #ddd'}),
html.Div([
    # TITLE WITH CSS CLASS FOR ANIMATION
    html.H1("How much money does it costs U.S. households to eat a sufficient quantity and variety of fruits and vegetables?",
            className="main-title mb-2"),
    html.P("Analyze the true cost and generate your shopping list", className="text-center text-muted")
], className="mb-2 p-3", style={'color': 'black'}),
# Styling the second HR line
html.Hr(style={'margin-top': '0.5rem', 'margin-bottom': '1.5rem', 'border-top': '1px solid #ddd'}),

# Accordion to consolidate inputs
dbc.Accordion([
    dbc.AccordionItem(config_card, title="1. Household Configuration"),
    dbc.AccordionItem(selector_card, title="2. Products and Quantities")
], active_item="item-2", always_open=False, className="mb-4 shadow-lift"),

# Analysis button
dbc.Button(
    "📊 ANALYZE MY BASKET",
    id='analyze-btn',
    color="primary",
    size="lg",
    className="w-100 mb-4",
    style={'height': '60px', 'fontSize': '20px', 'fontWeight': 'bold'},
    n_clicks=0
),

# RESULTS SECTION (Controlled by Radio Items)
html.Div(id='results-container', children=[
    dbc.Card([
        dbc.CardBody([
            # Radio Items to select the view
            dbc.RadioItems(
                id='results-view-selector',
                options=[
                    {'label': '1. Overview & Savings', 'value': 'overview_savings'}, # Fused tab
                    {'label': '2. Shopping List', 'value': 'shopping'},
                    {'label': '3. USDA Goals', 'value': 'nutritional'}
                ],
                value='overview_savings',  # Default view
                className="d-flex flex-wrap justify-content-center mb-4",
                inline=True,
                labelClassName="btn btn-outline-primary m-1",
                inputCheckedClassName="btn-check"
            ),
            # Container where content will be loaded dynamically
            html.Div(id='results-content')
        ])
    ], className="mb-4 shadow-lift")
], style={'display': 'none'}), # Hidden by default

# dcc.Store to save the generated analysis data
dcc.Store(id='analysis-data'),

# FOOTER COMPONENT
html.Div(
    dbc.Container(
        dbc.Row(
            dbc.Col(
                html.P([
                    "Dashboard made using Plotly-Dash by ",
                    html.Span("Avacsiglo21", style={'fontWeight': 'bold'}),
                    ". Thank you USDA for the Data"
                ], className="text-center text-white my-2")
            ),
        ),
        fluid=True
    ),
    className="bg-dark text-white p-3 mt-4",
    style={'position': 'sticky', 'bottom': '0'}
)
], fluid=True, style={‘maxWidth’: ‘1400px’, ‘padding’: ‘30px’, ‘backgroundColor’: ‘#FFFFFF’})
=================================================================
3. CALLBACKS
=================================================================
USDA recommendation callback (text changed to English)
@app.callback(
Output(‘usda-recommendation’, ‘children’),
Input(‘people’, ‘value’)
)
def show_usda_recommendation(people):
# USDA calculation logic
weekly_fruit = people * 2 * 7
weekly_veg = people * 2.5 * 7
total = weekly_fruit + weekly_veg
return html.Div([
    html.Strong("USDA Recommendation for your household: "),
    f"{total:.0f} cups per week ({weekly_fruit:.0f} fruits + {weekly_veg:.0f} vegetables)"
])
Product inputs callback
@app.callback(
Output(‘product-inputs’, ‘children’),
Input(‘product-selector’, ‘value’)
)
def render_product_inputs(selected_products):
if not selected_products:
return html.P(“ Select products from the menu”, className=“text-muted text-center mt-3”)
inputs = []

for product in selected_products:
    product_variants = df[df['Item'] == product]
    category = product_variants.iloc[0]['Category']
    category_icon = "🍎" if category == "Fruit" else "🥕"

    inputs.append(
        dbc.Card([
            dbc.CardBody([
                dbc.Row([
                    dbc.Col([
                        html.H6(f"{category_icon} {product}", className="mb-2"),
                        dcc.Dropdown(
                            id={'type': 'form-selector', 'product': product},
                            options=[
                                {
                                    'label': f"{row['Form']} - ${row['Price']:.2f}/cup",
                                    'value': f"{row['Form']}|{row['Price']}"
                                }
                                for _, row in product_variants.iterrows()
                            ],
                            value=f"{product_variants.iloc[0]['Form']}|{product_variants.iloc[0]['Price']}",
                            clearable=False
                        )
                    ], md=6),
                    dbc.Col([
                        html.Label("Cups per week:", className="small mb-1"),
                        dbc.Input(
                            id={'type': 'quantity-input', 'product': product},
                            type='number',
                            value=7,
                            min=0.5,
                            step=0.5,
                            className="form-control"
                        )
                    ], md=3),
                    dbc.Col([
                        html.Label("Cost:", className="small mb-1"),
                        html.Div(id={'type': 'cost-display', 'product': product},
                               className="fw-bold text-primary")
                    ], md=3)
                ])
            ])
        ], className="mb-3 shadow-lift")
    )

return html.Div(inputs)
Cost display update callback (no text change needed)
@app.callback(
Output({‘type’: ‘cost-display’, ‘product’: ALL}, ‘children’),
[Input({‘type’: ‘form-selector’, ‘product’: ALL}, ‘value’),
Input({‘type’: ‘quantity-input’, ‘product’: ALL}, ‘value’)]
)
def update_cost_displays(forms, quantities):
costs =
for form_price, quantity in zip(forms, quantities):
if form_price and quantity:
price = float(form_price.split(‘|’)[1])
cost = price * quantity
costs.append(f"${cost:.2f}“)
else:
costs.append(”$0.00")
return costs
=== MAIN CALLBACK: ANALYSIS AND DATA STORAGE ===
@app.callback(
[Output(‘analysis-data’, ‘data’),
Output(‘results-container’, ‘style’)], # Show/Hide results container
Input(‘analyze-btn’, ‘n_clicks’),
[State(‘product-selector’, ‘value’),
State({‘type’: ‘form-selector’, ‘product’: ALL}, ‘value’),
State({‘type’: ‘form-selector’, ‘product’: ALL}, ‘id’),
State({‘type’: ‘quantity-input’, ‘product’: ALL}, ‘value’),
State(‘people’, ‘value’)],
prevent_initial_call=True
)
def run_analysis(n_clicks, selected_products, forms, form_ids, quantities, people):
if not selected_products or not forms:
    # Return error and hide container if data is missing
    return {'error': 'Select products'}, {'display': 'none'}

# --- DATA PROCESSING ---
user_basket = []
total_cost = 0
total_fruit_cups = 0
total_veg_cups = 0

for i, (form_value, quantity) in enumerate(zip(forms, quantities)):
    if not form_value or not quantity: continue

    product = form_ids[i]['product']
    form, price = form_value.split('|')
    price = float(price)
    cost = price * quantity

    product_data = df[df['Item'] == product].iloc[0]
    category = product_data['Category']

    yield_val = product_data['Yield']
    cup_weight = product_data.get('CupWeight', 0.33)
    edible_weight = quantity * cup_weight
    purchase_weight = edible_weight / yield_val

    if category == 'Fruit': total_fruit_cups += quantity
    else: total_veg_cups += quantity
    total_cost += cost

    # Find alternatives
    alternatives = df[df['Item'] == product].copy()
    alternatives = alternatives[alternatives['Price'] < price]

    best_alternative = None
    if len(alternatives) > 0:
        best_alt = alternatives.nsmallest(1, 'Price').iloc[0]
        savings = (price - best_alt['Price']) * quantity
        if savings > 1:
            best_alternative = {
                'form': best_alt['Form'], 'price': best_alt['Price'],
                'savings_weekly': savings, 'savings_annual': savings * 52
            }

    all_prices_product = df[df['Item'] == product]['Price']
    percentile = (all_prices_product < price).sum() / len(all_prices_product) * 100

    user_basket.append({
        'product': product, 'form': form, 'price': price, 'quantity': quantity,
        'cost': cost, 'category': category, 'alternative': best_alternative,
        'price_percentile': percentile, 'yield': yield_val, 'buy_amount': purchase_weight
    })

# USDA Calculations
weekly_fruit_needed = people * 2 * 7
weekly_veg_needed = people * 2.5 * 7
fruit_coverage = (total_fruit_cups / weekly_fruit_needed * 100) if weekly_fruit_needed > 0 else 0
veg_coverage = (total_veg_cups / weekly_veg_needed * 100) if weekly_veg_needed > 0 else 0
total_savings = sum([item['alternative']['savings_weekly'] for item in user_basket if item['alternative']])

# Store in dcc.Store
analysis_results = {
    'basket': user_basket,
    'totals': {
        'cost': total_cost, 'savings': total_savings, 'fruit_cups': total_fruit_cups,
        'veg_cups': total_veg_cups, 'fruit_needed': weekly_fruit_needed,
        'veg_needed': weekly_veg_needed, 'fruit_coverage': fruit_coverage,
        'veg_coverage': veg_coverage,
    }
}

# Return data and make the results container visible
return analysis_results, {'display': 'block'}
=== CONDITIONAL VIEW CALLBACK (Controlled by Radio Items) ===
@app.callback(
Output(‘results-content’, ‘children’),
[Input(‘results-view-selector’, ‘value’),
Input(‘analysis-data’, ‘data’)]
)
def render_results_view(selected_view, data):
# Initial error handling
if not data or ‘error’ in data:
return dbc.Alert(“Press ‘ANALYZE MY BASKET’ to see results.”, color=“info”, className=“mt-3”)
basket = data['basket']
totals = data['totals']
# 1. OVERVIEW & SAVINGS
if selected_view == 'overview_savings':
# 1. Summary Cards
summary = dbc.Row([
dbc.Col([dbc.Card([dbc.CardBody([
html.H6("Current Cost", className="text-muted mb-2"),
html.H2(f"${totals['cost']:.2f}", className="text-primary fw-bold mb-1"),
html.Small("per week", className="text-muted")
], className="text-center")], className="h-100 shadow-lift")], md=3),
dbc.Col([dbc.Card([dbc.CardBody([
html.H6("Annual Cost", className="text-muted mb-2"),
html.H2(f"${totals['cost'] * 52:.0f}", className="text-danger fw-bold mb-1"),
html.Small("per year", className="text-muted")
], className="text-center")], className="h-100 shadow-lift")], md=3),
dbc.Col([dbc.Card([dbc.CardBody([
html.H6("Potential Savings", className="text-muted mb-2"),
html.H2(f"${totals['savings']:.2f}", className="text-success fw-bold mb-1"),
html.Small("per week", className="text-muted")
], className="text-center")], className="h-100 shadow-lift")], md=3),
dbc.Col([dbc.Card([dbc.CardBody([
html.H6("Annual Potential", className="text-muted mb-2"),
html.H2(f"${totals['savings'] * 52:.0f}", className="text-success fw-bold mb-1"),
html.Small("with better options", className="text-muted")
], className="text-center")], className="h-100 shadow-lift")], md=3)
], className="mb-4")
# --- 2. Bar Chart ---
# Filter items that have saving opportunities
savings_data = [
{'product': item['product'], 'savings': item['alternative']['savings_weekly']}
for item in basket if item['alternative']
]
if savings_data:
savings_df = pd.DataFrame(savings_data).sort_values(by='savings', ascending=True)
savings_fig = go.Figure(data=[
go.Bar(
x=savings_df['savings'],
y=savings_df['product'],
orientation='h',
marker_color='#28a745', # Bootstrap success green
text=[f"${s:.2f}" for s in savings_df['savings']],
textposition='outside',
)
])
savings_fig.update_layout(
title='Top Weekly Savings Opportunities (Prioritized)',
xaxis_title='Weekly Savings ($)',
yaxis_title='',
template="plotly_white",
height=max(350, 40 * len(savings_df)) # Dynamic height for readability
)
savings_chart = dbc.Row([
dbc.Col([
dbc.Card([
dbc.CardHeader(html.H5("💸 Savings Priority", className="mb-0")),
dbc.CardBody(dcc.Graph(figure=savings_fig, config={'displayModeBar': False}))
], className="shadow-lift")
], md=12)
], className="mb-4 mt-3")
else:
savings_chart = dbc.Alert("✅ No immediate savings opportunities found. You are buying the cheapest forms available!", color="success", className="mt-3")
# --- 3. Detailed Opportunities List (from old 'strategy') ---
opportunities = []
for item in basket:
if item['alternative']:
alt = item['alternative']
opp_card = dbc.Card([
dbc.CardBody([
dbc.Row([
dbc.Col([html.H6(f"💡 {item['product']}", className="mb-2"),
html.P([
"You Buy: ", html.Strong(f"{item['form']} at ${item['price']:.2f}"), html.Br(),
"Alternative: ", html.Strong(f"{alt['form']} at ${alt['price']:.2f}", className="text-success")
], className="mb-0 small")
], md=8),
dbc.Col([
html.Div([
html.H5(f"${alt['savings_weekly']:.2f}", className="text-success mb-0"),
html.Small("savings/week")
], className="text-center")
], md=4)
])
])
], className="mb-2 shadow-lift", color="light")
opportunities.append(opp_card)
opportunities_card = dbc.Card([
dbc.CardHeader(html.H5("🎯 Detailed Savings Opportunities", className="mb-0")),
dbc.CardBody(opportunities)
], className="shadow-lift mt-3")
return html.Div([
summary,
savings_chart,
opportunities_card
])
# 2. SHOPPING LIST
elif selected_view == 'shopping':
shopping_rows = []
for item in basket:
yield_color = "text-success" if item['yield'] > 0.9 else "text-warning" if item['yield'] > 0.7 else "text-danger"
row = html.Tr([
html.Td(item['product']), html.Td(item['form']), html.Td(f"{item['quantity']} cups"),
html.Td(f"{item['yield']*100:.0f}%", className=yield_color),
html.Td(html.Strong(f"{item['buy_amount']:.2f} lbs")),
html.Td(f"${item['cost']:.2f}")
])
shopping_rows.append(row)
shopping_table = dbc.Card([
dbc.CardHeader(html.H5("📝 Estimated Shopping List (Weekly)", className="mb-0 text-white"), style={"backgroundColor": "#4B77BE"}),
dbc.CardBody([
dbc.Table([
html.Thead([
html.Tr([
html.Th("Product"), html.Th("Form"), html.Th("Consumption"),
html.Th("Yield"), html.Th("To Buy (Weight)"), html.Th("Est. Cost")
])
]),
html.Tbody(shopping_rows)
], striped=True, bordered=True, hover=True, responsive=True),
html.Small("* 'To Buy' considers the weight of peels, stems, and seeds.", className="text-muted")
])
], className="shadow-lift mt-3")
return shopping_table
# 3. USDA GOALS (NO CHANGE NEEDED IN VALUE)
elif selected_view == 'nutritional':
coverage_fig = go.Figure()
# Changed Plotly theme to plotly_white for minimalist look
coverage_fig.update_layout(template="plotly_white")
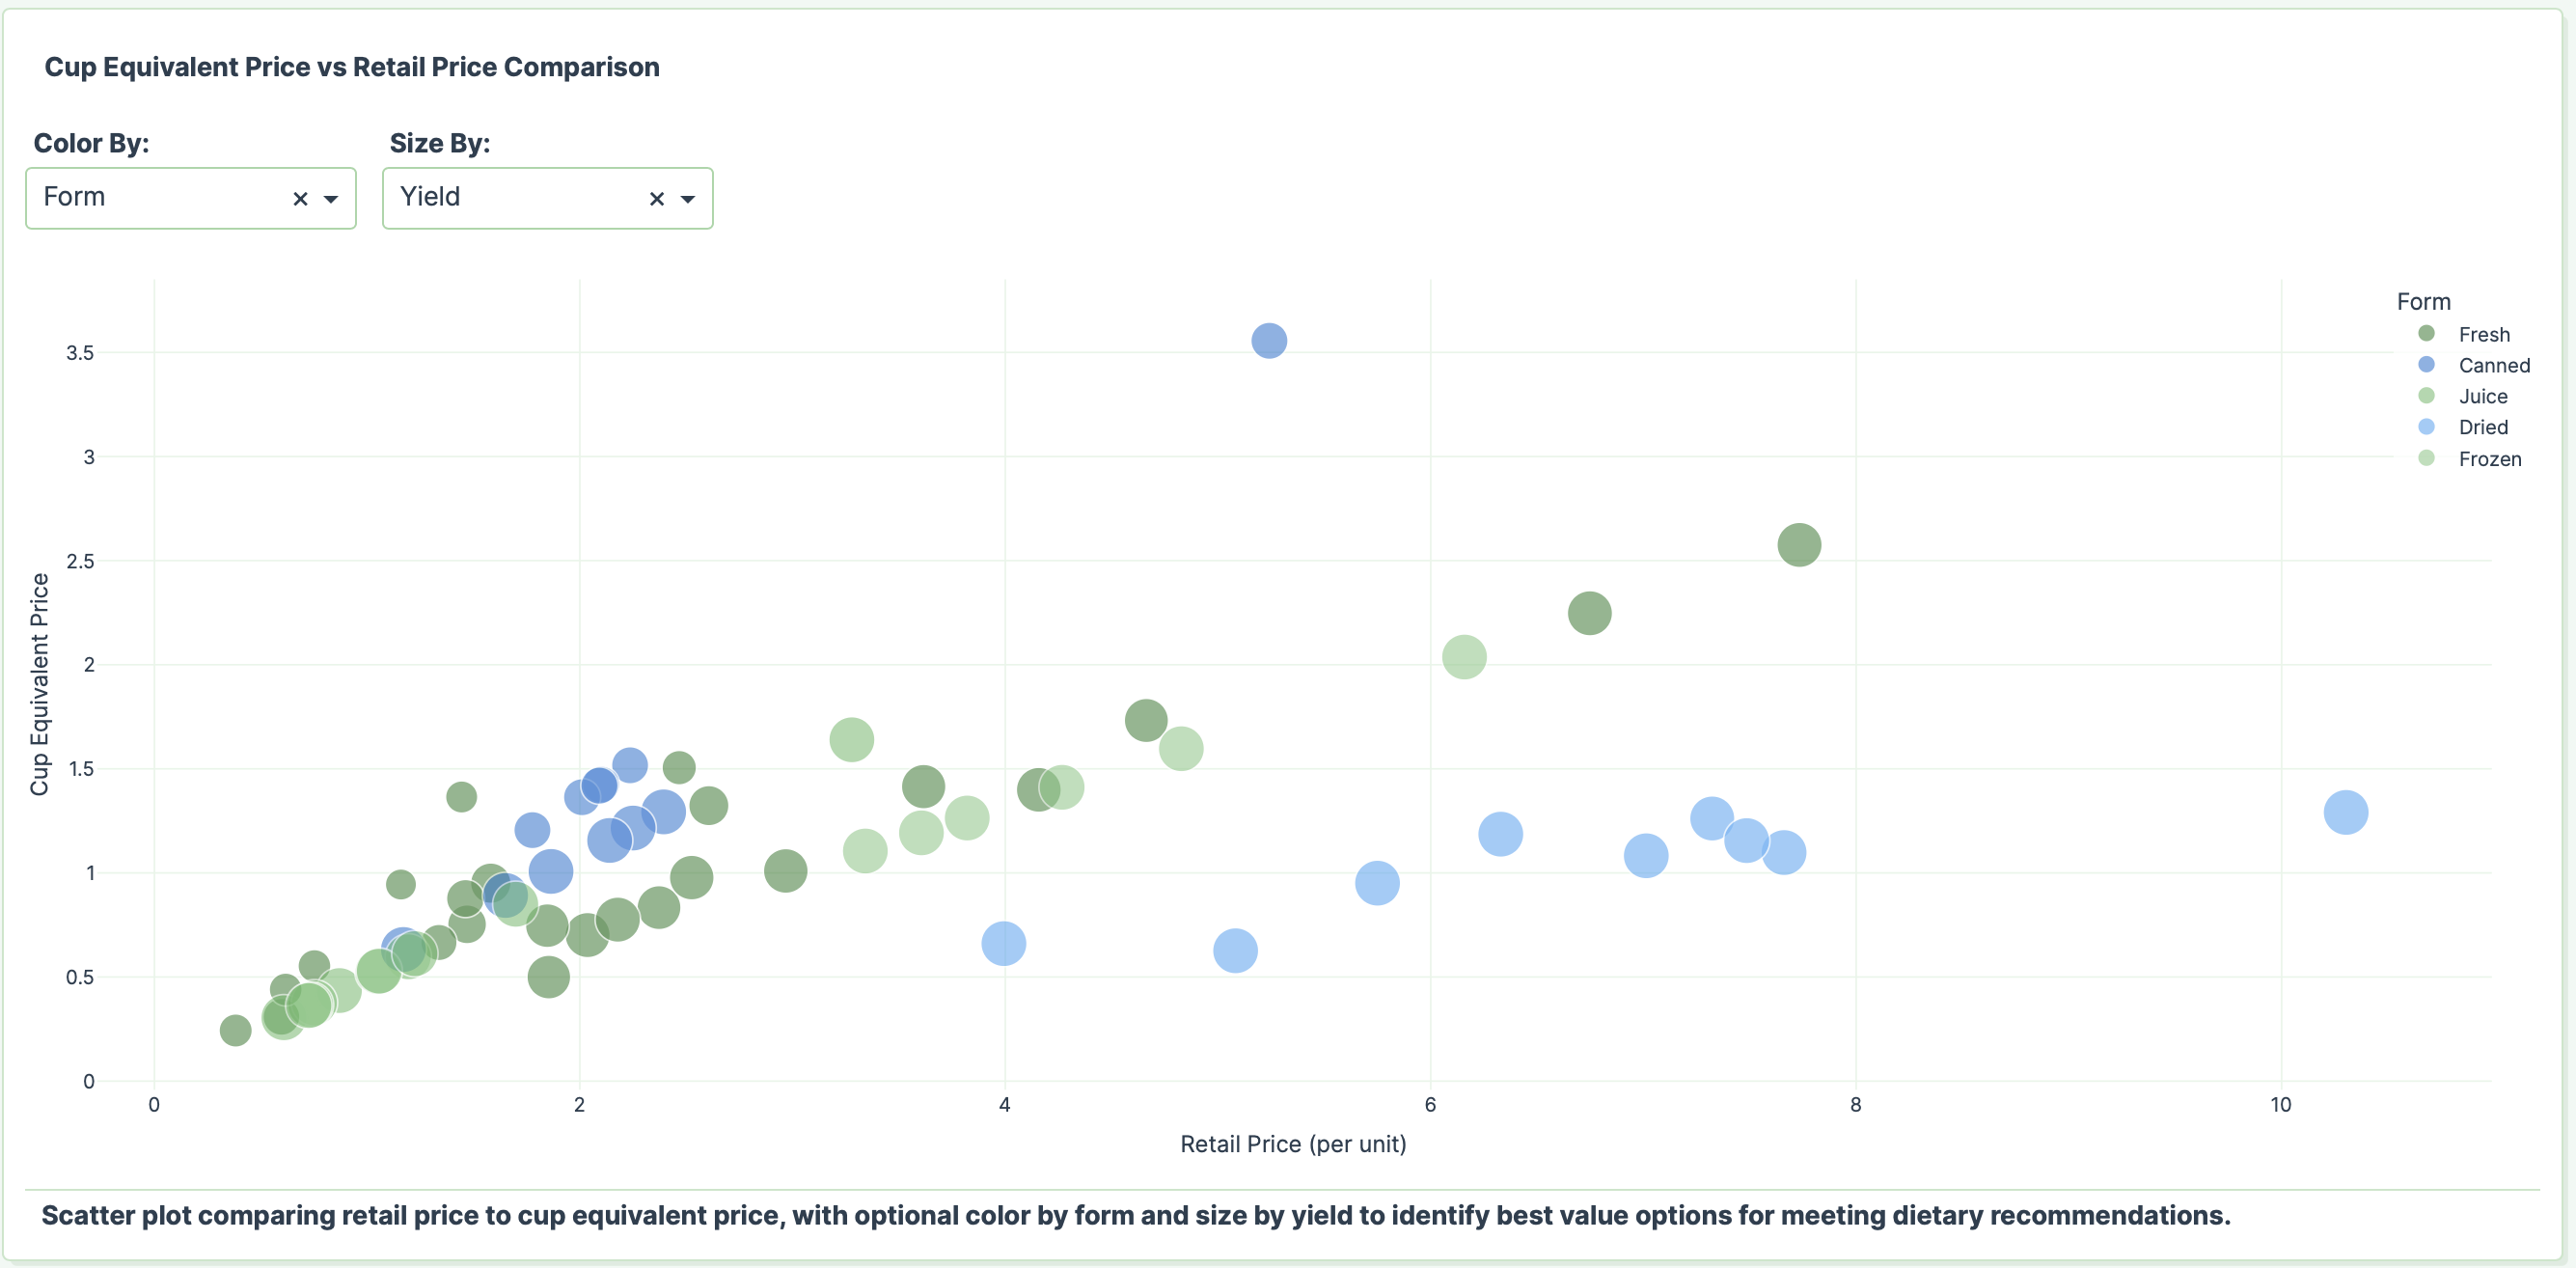
coverage_fig.add_trace(go.Bar(
name='Your Consumption', x=['Fruits', 'Vegetables'], y=[totals['fruit_cups'], totals['veg_cups']],
marker_color='#51cf66', text=[f"{totals['fruit_cups']:.1f} cups", f"{totals['veg_cups']:.1f} cups"],
textposition='inside', textfont=dict(size=14, color='white')
))
coverage_fig.add_trace(go.Bar(
name='USDA Recommendation', x=['Fruits', 'Vegetables'], y=[totals['fruit_needed'], totals['veg_needed']],
marker_color='rgba(102, 126, 234, 0.3)', text=[f"{totals['fruit_needed']:.0f} cups", f"{totals['veg_needed']:.0f} cups"],
textposition='inside', textfont=dict(size=14)
))
coverage_fig.update_layout(title="USDA Recommendation Coverage", barmode='overlay', height=350)
nutritional_content = dbc.Row([
dbc.Col([
dbc.Card([dbc.CardBody([dcc.Graph(figure=coverage_fig, config={'displayModeBar': False})])], className="shadow-lift")
], md=6),
dbc.Col([
dbc.Card([dbc.CardBody([
html.H5("📊 Nutritional Summary", className="mb-3"),
html.P("Fruits:", className="fw-bold mb-1"),
dbc.Progress(value=min(totals['fruit_coverage'], 100), label=f"{totals['fruit_coverage']:.0f}%", color="success" if totals['fruit_coverage'] >= 100 else "warning", className="mb-3"),
html.P("Vegetables:", className="fw-bold mb-1"),
dbc.Progress(value=min(totals['veg_coverage'], 100), label=f"{totals['veg_coverage']:.0f}%", color="success" if totals['veg_coverage'] >= 100 else "warning")
])], className="shadow-lift", style={'height': '100%'})
], md=6)
], className="mt-3")
return nutritional_content
# Fallback in case of unknown view (should not happen with Radio Items)
return dbc.Alert("Invalid view selected.", color="danger", className="mt-3")
=================================================================
4. RUN
=================================================================
if name == ‘main’:
app.run(debug=True, jupyter_mode=‘external’)