Figure Friday 2025 - week 31

join the Figure Friday session on August 8, at noon Eastern Time, to showcase your creation and receive feedback from the community.

What was the most desirable candy according to the FiveThirtyEight experiment?

Answer this question and a few others by using Plotly and Dash on the Candy Power Ranking dataset.

Things to consider:

  • what can you improve in the app or sample figure below (scatter plot)?
  • would you like to tell a different data story using a different graph or Dash app?
  • how can you explore the data with Plotly Studio?

Sample figure:

Code for sample figure:
from dash import Dash, dcc
import dash_ag_grid as dag
import plotly.express as px
import pandas as pd

df = pd.read_csv("candy-data.csv")
df_filtered = df[df['chocolate'] == 1]
fig = px.scatter(df_filtered, x='sugarpercent', y='winpercent', trendline='ols')

grid = dag.AgGrid(
    rowData=df.to_dict("records"),
    columnDefs=[{"field": i, 'filter': True, 'sortable': True} for i in df.columns],
    dashGridOptions={"pagination": True},
    columnSize="sizeToFit"
)

app = Dash()
app.layout = [
    grid,
    dcc.Graph(figure=fig)
]


if __name__ == "__main__":
    app.run(debug=True)

For community members that would like to build the data app with Plotly Studio, but don’t have the application yet, simply click the Apply For Early Access button on Plotly.com/studio and fill out the form. You should get the invite and download emails shortly after. Please keep in mind that Plotly Studio is still in early access.

Below is a screenshot of the Plotly Studio app built on top of this dataset:

Participation Instructions:

  • Create - use the weekly data set to build your own Plotly visualization or Dash app. Or, enhance the sample figure provided in this post, using Plotly or Dash.
  • Submit - post your creation to LinkedIn or Twitter with the hashtags #FigureFriday and #plotly by midnight Thursday, your time zone. Please also submit your visualization as a new post in this thread.
  • Celebrate - join the Figure Friday sessions to showcase your creation and receive feedback from the community.

:point_right: If you prefer to collaborate with others on Discord, join the Plotly Discord channel.

Data Source:

Thank you to FiveThirtyEight for the data.

3 Likes

hmm… a very ‘clean’ dataset!

1 Like

Hey all, my approach was simple as per the Candy power ranking but with an addition of appeal score, to showcase which candy isn’t getting biased with the price and win percent. Hence built a simple correlation and top 5 or top 10 candies. Also added a simple conclusion, which apparently ranks Reese way above what people suggested in 2017. I tried to keep the theme for halloween and dash_bootstrap_components.Card is interesting and simple to use too.

Here’s the code:

Here’s the github link: Week 31

2 Likes

@rishinigam nice job on your dashboard. I like how you incorporated Halloween themed colors, so appropriate for this dataset.

UPDATE: I removed this dashboad from plotly cloud to make room for other projects. You can reproduce this work from the provided code

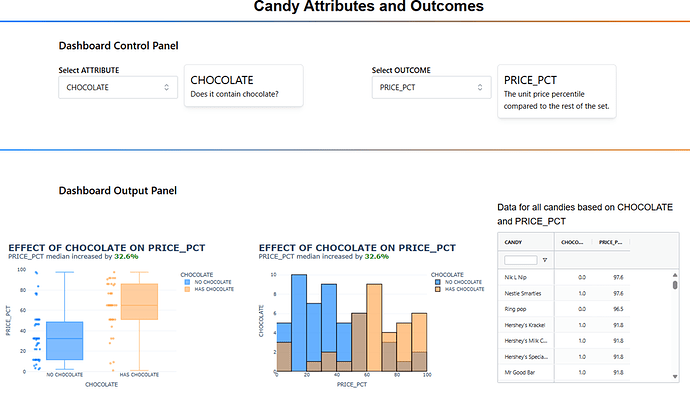
This submission grouped columns by attributes and outcomes. Attributes include Bar, Chocolate, Caramel, etc., and have values 0 or 1 only. Outcomes describe the unit price, winning percentage, and sugar, all expressed as percentages from 0 to 100. The pulldowns for selecting attributes and outcomes have a card next to them describing the selected choice.

The Dashboard Control Panel has two pulldown menus to select an attribute and outcome. Each pulldown has an adjacent card describing its selected value’

The box plot and histogram include data for selected attribute and outcome. The dash-ag table lists all candies for the selected attribute and outcome. The table is reverse sorted by outcome (highest value on top) with a floating filter for the candy name.

The box plot uses option points = ‘all’. This option is great for boxplots with small number of categories (2 in this case), and less useful for boxplots with many categories, where the displayed points add to much clutter.

The histogram uses overlay mode to show the distributions for outcomes with and without the selected attribute. It can be hard to read for small data sets like this, but the patterns are somewhat visible.

Here is a full screenshot for Price Percentages of chocolate candies, followed by a similar screenshot for fruity candies. It is easy to see which category returns more revenue.

I am planning to deploy this to the new Plotly Cloud and will add a link later this week. Here is the code:

import polars as pl
import polars.selectors as cs
import plotly.express as px
import dash_ag_grid as dag
import dash
from dash import Dash, dcc, html, Input, Output
import dash_mantine_components as dmc
dash._dash_renderer._set_react_version('18.2.0')

#----- GLOBALS -----------------------------------------------------------------
style_horizontal_thick_line = {'border': 'none', 'height': '4px', 
    'background': 'linear-gradient(to right, #007bff, #ff7b00)', 
    'margin': '10px,', 'fontsize': 32}

style_horizontal_thin_line = {'border': 'none', 'height': '2px', 
    'background': 'linear-gradient(to right, #007bff, #ff7b00)', 
    'margin': '10px,', 'fontsize': 12}

style_h2 = {'text-align': 'center', 'font-size': '40px', 
            'fontFamily': 'Arial','font-weight': 'bold'}
style_h3 = {'text-align': 'center', 'font-size': '24px', 
            'fontFamily': 'Arial','font-weight': 'normal'}

dict_attr_desc = {
    'CHOCOLATE'	     : 'Does it contain chocolate?',
    'FRUITY'         : 'Is it fruit flavored?',
    'CARAMEL'        : 'Is there caramel in the candy?',
    'PEANUT_ALMOND'  : 'Does it contain peanuts, peanut butter or almonds?',
    'NOUGAT'         : 'Does it contain nougat?',
    'CRISP_RICE_WAF' : 
        'Does it contain crisped rice, wafers, or a cookie component?',      
    'HARD'           :	'Is it a hard candy?',
    'BAR'            :	'Is it a candy bar?',
    'PLURIBUS'       :	'Is it one of many candies in a bag or box?'
}
dict_outcome_desc = {
    'SUGAR_PCT': 'The percentile of sugar it falls under within the data set.',
    'PRICE_PCT': 'The unit price percentile compared to the rest of the set.',
    'WIN_PCT'  : 'The overall win percentage according to 269,000 matchups.',
}
color1='rgba(0, 123, 255, 0.6)'  # blue
color2='rgba(255, 159, 64, 0.6)' # orange

#----- GATHER AND CLEAN DATA ---------------------------------------------------
df = (
    pl.read_csv('candy-data.csv')
    .rename(lambda c: c.upper()) # all column names to upper case
    .rename({                    # renames to reduce size of long names
        'COMPETITORNAME'   : 'CANDY', 
        'SUGARPERCENT'     : 'SUGAR_PCT',
        'PRICEPERCENT'     : 'PRICE_PCT',
        'WINPERCENT'       : 'WIN_PCT',
        'PEANUTYALMONDY'   : 'PEANUT_ALMOND',
        'CRISPEDRICEWAFER' : 'CRISP_RICE_WAF',
    })
    # Sugar and Price - change Percentage ranges from 1 max to 100 max
    .with_columns(pl.col('SUGAR_PCT', 'PRICE_PCT')*100.0) 
    .with_columns(cs.integer().cast(pl.UInt8))  # columns with 0's and 1's only
    .with_columns(cs.float().cast(pl.Float32))  # percents don't need Float64
)
# next 2 lines use polars column selectors to group by type - easy and powerful
attribute_list = sorted(df.select(cs.integer()).columns)
outcome_list = sorted(df.select(cs.float()).columns)

#----- DASH COMPONENTS------ ---------------------------------------------------
dmc_select_attribute = (
    dmc.Select(
        label='Select ATTRIBUTE',
        placeholder="Select one",
        id='attribute',
        data=attribute_list,
        value=attribute_list[0],
        size='xl',
    ),
)

dmc_select_outcome = (
    dmc.Select(
        label='Select OUTCOME',
        placeholder="Select one",
        id='outcome',
        data=outcome_list,
        value=outcome_list[0],
        size='xl',
    ),
)
attribute_card = dmc.Card(
    children=[
        dmc.Text('attr-title', fz=30, id='attr-title'),
        dmc.Text('attr-text', fz=20, id='attr-text'),
    ],
    withBorder=True,
    shadow='sm',
    radius='md'
)

outcome_card = dmc.Card(
    children=[
        dmc.Text('outcome-title', fz=30, id='outcome-title'),
        dmc.Text('outcome-text', fz=20, id='outcome-text'),
    ],
    withBorder=True,
    shadow='sm',
    radius='md'
)

#----- FUNCTIONS ---------------------------------------------------------------
def get_ag_col_defs(columns):
    ''' return setting for ag columns, with numeric formatting '''
    ag_col_defs = [{   # make CANDY column wider, pinned with floating filter
        'field':'CANDY', 
        'pinned':'left',
        'width': 150, 
        'floatingFilter': True,
        "filter": "agTextColumnFilter", 
        "suppressHeaderMenuButton": True
    }]
    for col in columns[1:]:   # applies to data columns, floating point
        ag_col_defs.append({
            'headerName': col,
            'field': col,
            'type': "numericColumn",
            'valueFormatter': {"function": "d3.format('.1f')(params.value)"},
            'width' : 100,
            'floatingFilter': False,
            'suppressHeaderMenuButton' : True,
        })
    return ag_col_defs
 
def get_median(df, attribute, filter, outcome):
    ''' return median value for specific attribute, outcome '''
    return df.filter(pl.col(attribute) == filter)[outcome].median()

def get_subtitle(outcome, direction, pct_color, median_shift):
    ''' return complex subtitle with f-strings and html color'''
    return (
        f'<sup>{outcome} median {direction} by ' +
        f'<b><span style="color:{pct_color}">' +
        f'{abs(median_shift):.1f}%</span></b>'
    )

def get_box_plot(attribute, outcome):
    ''' returns plotly graph objects box_plot, created with px.box API '''
    
    df_box = ( # make data frame for this attribute, outcome
        df
        .select(attribute, outcome)
        .with_columns(
            pl.col(attribute)
            .cast(pl.String())
            .replace('0', f'NO {attribute}')
            .replace('1', f'HAS {attribute}')
        )
        .with_columns(MEDIAN = pl.col(outcome).median().over(attribute))
        .sort(attribute, descending=True)
    )
    print(df_box)
    no_median = get_median(df_box, attribute, f'NO {attribute}',  outcome)
    has_median = get_median(df_box,attribute, f'HAS {attribute}', outcome)
    median_shift = has_median - no_median
    direction='decreased'
    pct_color = 'red'
    if median_shift > 0.0:
        direction='increased'
        pct_color = 'green'

    fig = px.box(
        df_box,
        x=attribute,
        y=outcome,
        template='plotly_white',
        title=(
            f'<b>EFFECT OF {attribute} ON {outcome}</b><br>' +
            get_subtitle(outcome, direction, pct_color, median_shift)
        ),
        color=attribute,
        color_discrete_map = {
            f'NO {attribute}' : color1,
            f'HAS {attribute}' : color2,
        },
        points='all', # shows datapoints next to each box_plot item
    )   
    fig.update_xaxes(
        categoryorder='array', 
        categoryarray= [f'NO {attribute}', f'HAS {attribute}']
    )
    fig.update_layout(
        yaxis_range=[0,100],
        title_font=dict(size=24),
    )
    return fig

def get_histogram(attribute, outcome):
    ''' returns plotly graph objects histogram, created with px.box API '''
    
    df_hist = (  # make data frame for this attribute, outcome
        df
        .select(attribute, outcome)
        .with_columns(
            pl.col(attribute)
            .cast(pl.String())
            .str.replace('0', f'NO {attribute}')
            .str.replace('1', f'HAS {attribute}')
        )
        .sort(attribute, descending=True)
    )
    no_median = get_median(df_hist, attribute, f'NO {attribute}',  outcome)
    has_median = get_median(df_hist,attribute, f'HAS {attribute}', outcome)
    median_shift = has_median - no_median

    direction='decreased'
    pct_color = 'red'
    if median_shift > 0.0:
        direction='increased'
        pct_color = 'green'
    fig = px.histogram(
        df_hist, 
        x=outcome, 
        color=attribute,
        color_discrete_map = {
            f'NO {attribute}' : color1,
            f'HAS {attribute}' : color2,
        },
        template='plotly_white',
        title=(
            f'<b>EFFECT OF {attribute} ON {outcome}</b><br>' +
            get_subtitle(outcome, direction, pct_color, median_shift)
        ),
    )
    # Update layout for overlay and transparency
    fig.update_layout(
        barmode='overlay',
        xaxis_title=outcome,
        yaxis_title=attribute,
        title_font=dict(size=24),
    )
    fig.update_traces(
        marker_line_color='black',
        marker_line_width=1.5
    )
    return fig

#----- DASH APPLICATION STRUCTURE-----------------------------------------------
app = Dash()
app.layout =  dmc.MantineProvider([
    dmc.Space(h=30),
    html.Hr(style=style_horizontal_thick_line),
    dmc.Text('Candy Attributes and Outcomes', ta='center', style=style_h2),
    dmc.Text('', ta='center', style=style_h3, id='zip_code'),
    html.Hr(style=style_horizontal_thick_line),
    dmc.Space(h=30),
    dmc.Grid(children = [
        dmc.GridCol(dmc.Text('Dashboard Control Panel', 
            fw=500, # semi-bold
            style={'fontSize': 28},
            ),
            span=3, offset=1
        )]
    ),
    dmc.Space(h=30),
    dmc.Grid(children = [
        dmc.GridCol(dmc_select_attribute, span=2, offset = 1),
        dmc.GridCol(attribute_card,span=2, offset=0),
        dmc.GridCol(dmc_select_outcome, span=2, offset = 1),
        dmc.GridCol(outcome_card,span=2, offset=0),
    ]),  
    dmc.Space(h=75),
    html.Hr(style=style_horizontal_thin_line),
    dmc.Space(h=75),
        dmc.Grid(children = [
        dmc.GridCol(dmc.Text(
            'Dashboard Output Panel', 
            fw=500, # semi-bold
            style={'fontSize': 28},
            ),
            span=3, offset=1
        )]
    ),

    dmc.Grid(children = [
        dmc.GridCol(
            dmc.Text(
                'Data for each value of {attribute}, {outcome}', 
                ta='left', 
                style=style_h3,
                id='table-desc'
            ),
            span=3, offset=8
        )]
    ),
    dmc.Grid(  
        children = [
            dmc.GridCol(dcc.Graph(id='boxplot'), span=4, offset=0),
            dmc.GridCol(dcc.Graph(id='histogram'), span=4, offset=0), 
            dmc.GridCol(dag.AgGrid(id='ag-grid'),span=3, offset=0),           
        ]
    ),
])

@app.callback(
    Output('boxplot', 'figure'),
    Output('histogram', 'figure'),
    Output('ag-grid', 'columnDefs'),  # columns vary by dataset
    Output('ag-grid', 'rowData'),
    Output('attr-title', 'children'),   
    Output('attr-text', 'children'),
    Output('outcome-title', 'children'),   
    Output('outcome-text', 'children'),
    Output('table-desc', 'children'),
    Input('attribute', 'value'),
    Input('outcome', 'value'),
)
def update(attribute, outcome):
    box_plot = get_box_plot(attribute, outcome)
    histogram = get_histogram(attribute, outcome)
    df_table = (
        df
        .select('CANDY', attribute, outcome)
        .sort(outcome,descending=True)
    )
    ag_col_defs = get_ag_col_defs(df_table.columns)    
    ag_row_data = df_table.to_dicts()
    table_desc = f'Data for all candies based on {attribute} and {outcome}'
    return (
        box_plot, 
        histogram,  
        ag_col_defs, 
        ag_row_data,
        attribute,
        dict_attr_desc[attribute],
        outcome,
        dict_outcome_desc[outcome],
        table_desc
    )

if __name__ == '__main__':
    app.run(debug=True)
6 Likes

@Mike_Purtell looks good, neat and clear. Will give dash_mantine_components a shot next friday challenge :wink:

1 Like

@Mike_Purtell your Dash apps are clearly getting more and more sophisticated. You’re making great progress with Dash. Were you able to get Plotly Cloud? I’d love to interact with the current app you built.

1 Like

Nice job @rishinigam . The heatmap makes it a lot easier to see the correlation between bars and nougat and bars and chocolate. I also loved the theme/color you used. Good usage of Dash Bootstrap.

1 Like

Hello Everyone,

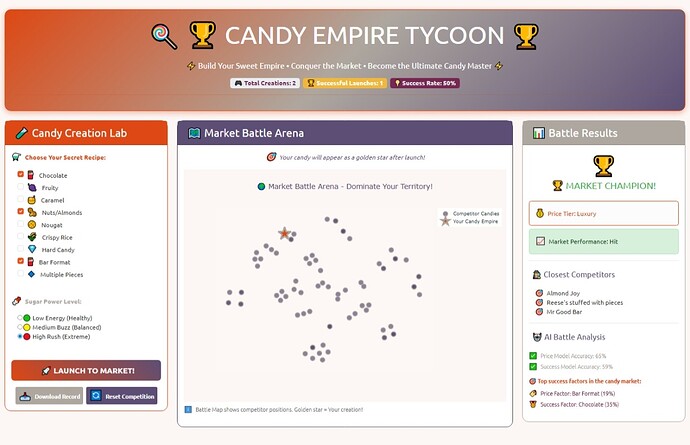
My approach for this week 31, is an inteacrtive web app, I call it “Candy Empire Tycoon.” It’s a gamified app where you can simulate creating a new candy and predict its market success.

The application uses two Machine Learning models (GradientBoostingClassifier) trained on real candy data to predict:

  • Price
  • Performance (whether it will be a “hit” or a “flop”)

Additionally, it visualizes your creation on a “Market Battle Map” generated with t-SNE, allowing you to see where your new candy stands in relation to the competition.


Key Features:

  • Dash Bootstrap Components: I used dash-bootstrap-components to create an attractive, responsive design with a “video game” theme.
  • Interactivity: Users can select ingredients and sugar levels, then press “Launch to Market” to see instant results.
  • Plotly Visualization: The t-SNE chart shows your candy’s “location” in the market, using a gold star to set it apart. Custom tooltips (hovertemplate) provide detailed information.
  • Game Functionality: A launch counter and success rate (dcc.Store and dcc.Download) keep a record of your creations.
  • ML Analysis: After each launch, the app reveals the predictions, closest competitors, and the most important success factors identified by the AI models.

Feel free to check out the attached code and give it a try. Any comments or suggestions to improve the app or the models are welcome!

After several attempts I could use plotly.cloud

The code

import dash
from dash import dcc, html, Input, Output, State
import plotly.graph_objects as go
import pandas as pd
import numpy as np
from sklearn.ensemble import GradientBoostingClassifier
from sklearn.manifold import TSNE
from sklearn.preprocessing import StandardScaler, LabelEncoder
from sklearn.model_selection import train_test_split
from sklearn.metrics import accuracy_score
from sklearn.metrics.pairwise import euclidean_distances

Import Dash Bootstrap Components

import dash_bootstrap_components as dbc

================================================================

1. Data Preparation and Machine Learning Models

================================================================

Simulate loading candy-data.csv if it doesn’t exist

To make the code self-contained and executable.

try:
df = pd.read_csv(“candy-data1.csv”)
except FileNotFoundError:
print(“File ‘candy-data.csv’ not found. Creating example DataFrame.”)
data = {
‘competitorname’: [‘100 Grand’, ‘3 Musketeers’, ‘One cup’, ‘Reeses Cup’, ‘Twix’, ‘Snickers’, ‘Kit Kat’, ‘Milky Way’, ‘Baby Ruth’, ‘M&M's’, ‘Sour Patch Kids’, ‘Skittles’],
‘chocolate’: [1, 1, 0, 1, 1, 1, 1, 1, 1, 1, 0, 0],
‘fruity’: [0, 0, 0, 0, 0, 0, 0, 0, 0, 0, 1, 1],
‘caramel’: [1, 0, 0, 0, 1, 1, 0, 1, 1, 0, 0, 0],
‘peanutyalmondy’: [0, 0, 0, 1, 0, 1, 0, 0, 1, 1, 0, 0],
‘nougat’: [0, 1, 0, 0, 0, 1, 0, 1, 1, 0, 0, 0],
‘crispedricewafer’: [1, 0, 0, 0, 0, 0, 1, 0, 0, 0, 0, 0],
‘hard’: [0, 0, 0, 0, 0, 0, 0, 0, 0, 0, 0, 0],
‘bar’: [1, 1, 0, 0, 1, 1, 1, 1, 1, 0, 0, 0],
‘pluribus’: [0, 0, 1, 0, 0, 0, 0, 0, 0, 1, 1, 1],
‘sugarpercent’: [0.732, 0.604, 0.052, 0.723, 0.546, 0.762, 0.313, 0.604, 0.604, 0.825, 0.069, 0.946],
‘pricepercent’: [0.86, 0.767, 0.116, 0.723, 0.325, 0.651, 0.767, 0.767, 0.767, 0.651, 0.116, 0.325],
‘winpercent’: [66.97, 67.67, 22.84, 82.98, 54.06, 76.67, 72.88, 73.09, 68.53, 66.57, 52.88, 63.08]
}
df = pd.DataFrame(data)

Binarize sugarpercent column into 3 levels (‘low’, ‘medium’, ‘high’)

q1_sugar, q3_sugar = df[‘sugarpercent’].quantile(0.25), df[‘sugarpercent’].quantile(0.75)
def categorize_sugar(x):
if x <= q1_sugar:
return 0
elif x <= q3_sugar:
return 1
else:
return 2

df[‘sugar_level’] = df[‘sugarpercent’].apply(categorize_sugar)

Convert continuous price and popularity variables into categories

df[‘price_level’] = pd.qcut(df[‘pricepercent’], q=3, labels=[‘Budget’, ‘Premium’, ‘Luxury’])
df[‘win_level’] = df[‘winpercent’].apply(lambda x: ‘Hit’ if x > 50 else ‘Flop’)

Use LabelEncoder to convert string labels to numeric

le_price = LabelEncoder()
le_win = LabelEncoder()
df[‘price_level_encoded’] = le_price.fit_transform(df[‘price_level’])
df[‘win_level_encoded’] = le_win.fit_transform(df[‘win_level’])

Define features and labels for the models

feature_columns = [‘chocolate’, ‘fruity’, ‘caramel’, ‘peanutyalmondy’, ‘nougat’,
‘crispedricewafer’, ‘hard’, ‘bar’, ‘pluribus’, ‘sugar_level’]

X = df[feature_columns]
y_price_level_encoded = df[‘price_level_encoded’]
y_win_level_encoded = df[‘win_level_encoded’]

Split data for training and testing (80% training, 20% testing)

X_train_price, X_test_price, y_price_train_encoded, y_price_test_encoded = train_test_split(X, y_price_level_encoded, test_size=0.2, random_state=42)
X_train_win, X_test_win, y_win_train_encoded, y_win_test_encoded = train_test_split(X, y_win_level_encoded, test_size=0.2, random_state=42)

Train ML models on training set

price_model = GradientBoostingClassifier(n_estimators=50, max_depth=2, random_state=42)
price_model.fit(X_train_price, y_price_train_encoded)

X_win_train = pd.concat([X_train_win, pd.Series(y_price_train_encoded, index=X_train_win.index, name=‘price_level_encoded’)], axis=1)
win_model = GradientBoostingClassifier(n_estimators=50, max_depth=2, random_state=42)
win_model.fit(X_win_train, y_win_train_encoded)

Calculate accuracy metrics for both models

y_price_pred_encoded = price_model.predict(X_test_price)
price_accuracy = accuracy_score(y_price_test_encoded, y_price_pred_encoded)

X_win_test_with_price = pd.concat([X_test_win, pd.Series(y_price_pred_encoded, index=X_test_win.index, name=‘price_level_encoded’)], axis=1)
y_win_pred_encoded = win_model.predict(X_win_test_with_price)
win_accuracy = accuracy_score(y_win_test_encoded, y_win_pred_encoded)

Prepare data for t-SNE

scaler = StandardScaler()
X_scaled = scaler.fit_transform(X)
tsne = TSNE(n_components=2, perplexity=5, random_state=42, init=‘pca’)
X_tsne = tsne.fit_transform(X_scaled)
df[‘TSNE1’] = X_tsne[:, 0]
df[‘TSNE2’] = X_tsne[:, 1]

================================================================

2. Dash Application Setup and Layout (with Dash Bootstrap)

================================================================

Initialize application with United theme

app = dash.Dash(name, external_stylesheets=[dbc.themes.UNITED])

app.title=“Candy Empire Dashboard”

app.layout = dbc.Container([
# Gamified Header
dbc.Row([
dbc.Col(
html.Div(
[
html.Div([
html.Span(“:lollipop:”, style={‘font-size’: ‘60px’}, className=“me-3”),
html.H1(“:trophy: CANDY EMPIRE TYCOON”, className=“display-3 d-inline-block”),
html.Span(“:trophy:”, style={‘font-size’: ‘60px’}, className=“ms-3”),
], className=“d-flex align-items-center justify-content-center mb-3”),
html.P(“:high_voltage: Build Your Sweet Empire • Conquer the Market • Become the Ultimate Candy Master :high_voltage:”, className=“lead”),
html.Div(id=“game-stats”, children=[
dbc.Badge(“:video_game: Total Creations: 0”, color=“light”, className=“me-2 fs-6 text-dark”),
dbc.Badge(“:trophy: Successful Launches: 0”, color=“warning”, className=“me-2 fs-6”),
dbc.Badge(“:light_bulb: Success Rate: 0%”, color=“dark”, className=“fs-6 text-light”),
], className=“d-flex justify-content-center”),
html.Hr(className=“my-3”, style={‘border-color’: ‘#DD4814’}),
],
className=“p-4 mb-4 rounded-4 text-center text-white”,
style={
‘background’: ‘linear-gradient(135deg, #DD4814 0%, #AEA79F 50%, #5D4E75 100%)’,
‘border’: ‘2px solid #DD4814’,
‘box-shadow’: ‘0 4px 15px rgba(221, 72, 20, 0.4)’
}
),
)
]),

# Main Content with 3-column layout
dbc.Row([
    # Column 1: Candy Creation Lab (inside a card)
    dbc.Col([
        dbc.Card([
            dbc.CardHeader([
                html.Span(style={'font-size': '30px'}, className="me-2"),
                html.H3("🧪 Candy Creation Lab", className="d-inline-block text-center mb-0")
            ], className="text-white", style={'background-color': '#DD4814'}),
            dbc.CardBody([
                # Ingredient selection form
                html.Div([
                    dbc.Label([
                        html.Span("⚗️", style={'font-size': '20px'}, className="me-2"),
                        "Choose Your Secret Recipe:"
                    ], className="fw-bold mb-3", style={'color': '#DD4814'}),
                    dbc.Checklist(
                        id='candy-features-checklist',
                        options=[
                            {'label': [html.Span("🍫", style={'font-size': '20px'}, className="me-2"), ' Chocolate'], 'value': 'chocolate'},
                            {'label': [html.Span("🍇", style={'font-size': '20px'}, className="me-2"), ' Fruity'], 'value': 'fruity'},
                            {'label': [html.Span("🍯", style={'font-size': '20px'}, className="me-2"), ' Caramel'], 'value': 'caramel'},
                            {'label': [html.Span("🥜", style={'font-size': '20px'}, className="me-2"), ' Nuts/Almonds'], 'value': 'peanutyalmondy'},
                            {'label': [html.Span("🍪", style={'font-size': '20px'}, className="me-2"), ' Nougat'], 'value': 'nougat'},
                            {'label': [html.Span("🌾", style={'font-size': '20px'}, className="me-2"), ' Crispy Rice'], 'value': 'crispedricewafer'},
                            {'label': [html.Span("💎", style={'font-size': '20px'}, className="me-2"), ' Hard Candy'], 'value': 'hard'},
                            {'label': [html.Span("🍫", style={'font-size': '20px'}, className="me-2"), ' Bar Format'], 'value': 'bar'},
                            {'label': [html.Span("🔹", style={'font-size': '20px'}, className="me-2"), ' Multiple Pieces'], 'value': 'pluribus'}
                        ],
                        value=[],
                        className="ms-3",
                    ),
                ], className="mb-4"),

                # Sugar level selection
                html.Div([
                    dbc.Label([
                        html.Span("🍬", style={'font-size': '20px'}, className="me-2"),
                        "Sugar Power Level:"
                    ], className="fw-bold mt-3 mb-3", style={'color': '#AEA79F'}),
                    dcc.RadioItems(
                        id='sugar-level-radio',
                        options=[
                            {'label': '🟢 Low Energy (Healthy)', 'value': 0},
                            {'label': '🟡 Medium Buzz (Balanced)', 'value': 1},
                            {'label': '🔴 High Rush (Extreme)', 'value': 2}
                        ],
                        value=1,
                        className="ms-3"
                    )
                ], className="mb-4"),
                
                # Launch button
                html.Div(
                    dbc.Button([
                        html.Span(style={'font-size': '25px'}, className="me-2"),
                        "🚀 LAUNCH TO MARKET!"
                    ], id="launch-button", n_clicks=0,
                        size="lg", className="mt-4 fw-bold text-white",
                        style={'background': 'linear-gradient(45deg, #DD4814, #5D4E75)', 'border': 'none'}),
                    className="d-grid gap-2"
                ),
                # New buttons for download and reset
                html.Div([
                    dbc.Button([
                        html.Span("📥", style={'font-size': '25px'}, className="me-2"),
                        "Download Record"
                    ], id="download-button", n_clicks=0,
                        size="sm", className="me-2 mt-3 fw-bold text-white",
                        style={'background-color': '#AEA79F', 'border': 'none'}),
                    dcc.Download(id="download-data"),
                    
                    dbc.Button([
                        html.Span("🔄", style={'font-size': '25px'}, className="me-2"),
                        "Reset Competition"
                    ], id="reset-button", n_clicks=0,
                        size="sm", className="mt-3 fw-bold text-white",
                        style={'background-color': '#5D4E75', 'border': 'none'})
                ], className="d-flex justify-content-center"),
            ])
        ], className="rounded-4", style={'border': '2px solid #DD4814'}),
    ], md=3, className="mb-4"),

    # Column 2: Market Battle Map (inside a card)
    dbc.Col([
        dbc.Card([
            dbc.CardHeader([
                html.Span(style={'font-size': '30px'}, className="me-2"),
                html.H3("🗺️ Market Battle Arena", className="d-inline-block text-center mb-0")
            ], className="text-white", style={'background-color': '#5D4E75'}),
            dbc.CardBody([
                html.P([
                    html.Span("🎯", style={'font-size': '20px'}, className="me-2"),
                    "Your candy will appear as a golden star after launch!"
                ], className="text-center fst-italic", style={'color': '#5D4E75'}),
                dcc.Graph(id="tsne-market-map", style={'height': '600px'}),
                html.P([
                    html.Span("ℹ️", style={'font-size': '16px'}, className="me-2"),
                    "Battle Map shows competitor positions. Golden star = Your creation!"
                ], className="text-muted mt-2 small")
            ])
        ], className="rounded-4", style={'border': '2px solid #5D4E75'})
    ], md=6, className="mb-4"),

    # Column 3: Battle Results (inside a card)
    dbc.Col([
        dbc.Card([
            dbc.CardHeader([
                html.Span(style={'font-size': '30px'}, className="me-2"),
                html.H3("📊 Battle Results", className="d-inline-block text-center mb-0")
            ], className="text-white", style={'background-color': '#AEA79F'}),
            dbc.CardBody(id="prediction-results"),
        ], className="rounded-4", style={'border': '2px solid #AEA79F'})
    ], md=3, className="mb-4"),

], className="g-4"),

# Stores for game state and history
dcc.Store(id='game-state-store', data={'successful_launches': 0, 'total_launches': 0}),
dcc.Store(id='history-store', data=[]),

], fluid=True, className=“py-4”, style={‘background-color’: ‘#FCF7F5’})

================================================================

3. Callbacks for Application Logic

================================================================

@app.callback(
[Output(“tsne-market-map”, “figure”),
Output(“prediction-results”, “children”),
Output(“game-stats”, “children”),
Output(“game-state-store”, “data”),
Output(“history-store”, “data”)],
[Input(“launch-button”, “n_clicks”)],
[State(“candy-features-checklist”, “value”),
State(“sugar-level-radio”, “value”),
State(“game-state-store”, “data”),
State(“history-store”, “data”)]
)
def launch_candy(n_clicks, selected_features, sugar_level, game_data, history_data):
# Get current stats from stored data
current_total = game_data.get(‘total_launches’, 0)
current_successful = game_data.get(‘successful_launches’, 0)

# Create initial stats badges
stats_badges = [
    dbc.Badge(f"🎮 Total Creations: {current_total}", color="light", className="me-2 fs-6 text-dark"),
    dbc.Badge(f"🏆 Successful Launches: {current_successful}", color="warning", className="me-2 fs-6"),
    dbc.Badge(f"💡 Success Rate: {(current_successful/current_total*100) if current_total > 0 else 0:.0f}%", color="dark", className="fs-6 text-light"),
]

if n_clicks == 0:
    # Initial state of the graph
    fig = create_market_map(None, df['TSNE1'], df['TSNE2'])
    return fig, html.Div([
        html.Div([
            html.Span("⏰", style={'font-size': '40px'}, className="mb-3"),
            html.H5("⏳ Ready for Launch", className="text-center mb-3", style={'color': '#DD4814'}),
            html.P("Create your candy recipe and launch it to see how it performs in the market battle!", className="text-secondary")
        ], className="text-center")
    ]), stats_badges, game_data, history_data

# Convert user selections into feature vector
user_features = {
    'chocolate': 0, 'fruity': 0, 'caramel': 0, 'peanutyalmondy': 0, 'nougat': 0,
    'crispedricewafer': 0, 'hard': 0, 'bar': 0, 'pluribus': 0
}
for feature in selected_features:
    user_features[feature] = 1
# Add sugar level
user_features['sugar_level'] = sugar_level
# Create DataFrame for prediction
new_candy_df = pd.DataFrame([user_features])

# Predict price category
predicted_price_level_encoded = price_model.predict(new_candy_df[feature_columns])[0]
predicted_price_level = le_price.inverse_transform([predicted_price_level_encoded])[0]

# Predict popularity category using predicted price category
new_candy_for_win_level = new_candy_df.copy()
new_candy_for_win_level['price_level_encoded'] = predicted_price_level_encoded
predicted_win_level_encoded = win_model.predict(new_candy_for_win_level[feature_columns + ['price_level_encoded']])[0]
predicted_win_level = le_win.inverse_transform([predicted_win_level_encoded])[0]

# Recalculate t-SNE with the new candy
combined_df = pd.concat([df[feature_columns], new_candy_df[feature_columns]], ignore_index=True)
combined_scaled = scaler.fit_transform(combined_df)
combined_tsne = tsne.fit_transform(combined_scaled)
new_candy_tsne_coords = combined_tsne[-1]

# --- Find closest competitors using Euclidean Distance ---
existing_candies_features = X.values
new_candy_feature_vector = new_candy_df[feature_columns].values
distances = euclidean_distances(new_candy_feature_vector, existing_candies_features)
closest_indices = np.argsort(distances[0])[:3]
closest_competitors = df.iloc[closest_indices]['competitorname'].tolist()

fig = create_market_map({'TSNE1': new_candy_tsne_coords[0], 'TSNE2': new_candy_tsne_coords[1]}, combined_tsne[:-1, 0], combined_tsne[:-1, 1])

# Get feature importance for models
price_importances = pd.Series(price_model.feature_importances_, index=feature_columns).sort_values(ascending=False)
win_importances = pd.Series(win_model.feature_importances_, index=feature_columns + ['price_level_encoded']).sort_values(ascending=False)

# Convert feature names to readable format
feature_labels = {
    'chocolate': 'Chocolate', 'fruity': 'Fruity', 'caramel': 'Caramel', 'peanutyalmondy': 'Nuts/Almonds',
    'nougat': 'Nougat', 'crispedricewafer': 'Crispy Rice', 'hard': 'Hard Candy', 'bar': 'Bar Format',
    'pluribus': 'Multiple Pieces', 'sugar_level': 'Sugar Level', 'price_level_encoded': 'Price Tier'
}

# Calculate new totals
new_total = current_total + 1
new_successful = current_successful

# Determine battle result and update success counter
if predicted_win_level == 'Hit':
    result_icon = "🏆"
    result_color = "success"
    result_text = "🏆 MARKET CHAMPION!"
    new_successful += 1
else:
    result_icon = "💔"
    result_color = "secondary"
    result_text = "💔 Market Flop"

# Update stats badges with corrected counts
updated_stats_badges = [
    dbc.Badge(f"🎮 Total Creations: {new_total}", color="light", className="me-2 fs-6 text-dark"),
    dbc.Badge(f"🏆 Successful Launches: {new_successful}", color="warning", className="me-2 fs-6"),
    dbc.Badge(f"💡 Success Rate: {(new_successful/new_total*100):.0f}%", color="dark", className="fs-6 text-light"),
]

# Update game state
updated_game_data = {
    'successful_launches': new_successful,
    'total_launches': new_total
}

# --- NEW: Append to history data ---
new_launch_record = {
    'launch_id': new_total,
    'features': [feature_labels[f] for f in selected_features] + [feature_labels['sugar_level']],
    'predicted_price': predicted_price_level,
    'predicted_win': predicted_win_level,
    'closest_competitors': closest_competitors
}
history_data.append(new_launch_record)

# Prepare results to display
results = [
    html.Div([
        html.Span(result_icon, style={'font-size': '50px'}, className="mb-2"),
        html.H4(result_text, className=f"text-center text-{result_color}")
    ], className="text-center mb-4"),
    
    dbc.Alert([
        html.Span("💰", style={'font-size': '20px'}, className="me-2"),
        f"Price Tier: {predicted_price_level}"
    ], color="light", className="mb-2", style={'border-color': '#DD4814', 'color': '#DD4814'}),
    
    dbc.Alert([
        html.Span("📈", style={'font-size': '20px'}, className="me-2"),
        f"Market Performance: {predicted_win_level}"
    ], color=result_color, className="mb-3"),
    
    html.Hr(style={'border-color': '#AEA79F'}),
    
    html.Div([
        html.Span(style={'font-size': '25px'}, className="me-2"),
        html.H5("🕵️ Closest Competitors", className="d-inline-block", style={'color': '#5D4E75'})
    ], className="mb-3"),
    
    html.Ul([
        html.Li([
            html.Span("🎯", style={'font-size': '16px'}, className="me-2"),
            competitor
        ]) for competitor in closest_competitors
    ], className="list-unstyled", style={'padding-left': '1rem'}),
    
    html.Hr(style={'border-color': '#AEA79F'}),
    
    html.Div([
        html.Span(style={'font-size': '25px'}, className="me-2"),
        html.H5("🤖 AI Battle Analysis", className="d-inline-block", style={'color': '#5D4E75'})
    ], className="mb-3"),
    
    html.P([
        html.Span("✅", style={'font-size': '16px'}, className="me-2"),
        f"Price Model Accuracy: {price_accuracy:.0%}"
    ], className="mb-1 text-secondary small"),
    
    html.P([
        html.Span("✅", style={'font-size': '16px'}, className="me-2"),
        f"Success Model Accuracy: {win_accuracy:.0%}"
    ], className="mb-3 text-secondary small"),
    
    html.P("🎯 Top success factors in the candy market:", className="fw-bold mb-2 small", style={'color': '#DD4814'}),
    
    html.P([
        html.Span("🏷️", style={'font-size': '16px'}, className="me-2"),
        f"Price Factor: {feature_labels[price_importances.index[0]]} ({price_importances.iloc[0]:.0%})"
    ], className="text-dark small mb-1"),
    
    html.P([
        html.Span("🥇", style={'font-size': '16px'}, className="me-2"),
        f"Success Factor: {feature_labels[win_importances.index[0]]} ({win_importances.iloc[0]:.0%})"
    ], className="text-dark small"),
]

return fig, results, updated_stats_badges, updated_game_data, history_data

— MODIFIED CALLBACK: Download button functionality for .txt —

@app.callback(
Output(“download-data”, “data”),
Input(“download-button”, “n_clicks”),
State(“history-store”, “data”),
prevent_initial_call=True
)
def download_history(n_clicks, history_data):
# Ensure a dictionary is always returned, even if history is empty
records =
for record in history_data:
records.append({
‘Launch_ID’: record[‘launch_id’],
‘Ingredients’: ', '.join(record[‘features’]),
‘Price_Forecast’: record[‘predicted_price’],
‘Performance_Forecast’: record[‘predicted_win’],
‘Closest_Competitors’: ', '.join(record[‘closest_competitors’])
})
df_download = pd.DataFrame(records)

# Convert DataFrame to a simple string representation for .txt
txt_string = df_download.to_string(index=False)

# Return a dictionary with the content and filename for download
return dict(content=txt_string, filename="candy_empire_record.txt")

— NEW CALLBACK: Reset button functionality —

@app.callback(
[Output(“game-state-store”, “data”, allow_duplicate=True),
Output(“history-store”, “data”, allow_duplicate=True)],
Input(“reset-button”, “n_clicks”),
prevent_initial_call=True
)
def reset_game(n_clicks):
# Reset the stores to their initial state
return {‘successful_launches’: 0, ‘total_launches’: 0},

def create_market_map(new_candy_data, existing_tsne1, existing_tsne2):
“”“Creates the main t-SNE graph with a new candy.”“”

fig = go.Figure()

# Show all existing candies in the background
fig.add_trace(go.Scatter(
    x=existing_tsne1,
    y=existing_tsne2,
    mode='markers',
    name='Competitor Candies',
    marker=dict(color='rgba(93, 78, 117, 0.7)', size=12, 
                 line=dict(width=2, color='#AEA79F')),
    hovertemplate='<b>%{text}</b><br>Status: %{customdata[0]}<br>Win Rate: %{customdata[1]:.1f}%<br>Price Level: %{customdata[2]:.1f}%<extra></extra>',
    text=df['competitorname'],
    customdata=np.stack((df['win_level'], df['winpercent'], df['pricepercent'] * 100), axis=-1)
))

# Highlight user's new candy if one has been created
if new_candy_data:
    fig.add_trace(go.Scatter(
        x=[new_candy_data['TSNE1']],
        y=[new_candy_data['TSNE2']],
        mode='markers',
        name='Your Candy Empire',
        marker=dict(
            color='#DD4814',
            size=25,
            line=dict(width=4, color='#AEA79F'),
            symbol='star'
        ),
        hovertemplate='<b>🏆 YOUR CANDY EMPIRE</b><br>Position X: %{x:.2f}<br>Position Y: %{y:.2f}<extra></extra>'
    ))

# Clean map appearance
fig.update_layout(
    title={
        'text': "🌍 Market Battle Arena - Dominate Your Territory!",
        'x': 0.5,
        'font': {'size': 18, 'color': '#5D4E75'}
    },
    xaxis_title="",
    yaxis_title="",
    hovermode='closest',
    showlegend=True,
    legend=dict(
        font=dict(color='#2c3e50'),
        bgcolor='rgba(255, 255, 255, 0.9)'
    ),
    xaxis_visible=False,
    yaxis_visible=False,
    template="plotly_white",
    plot_bgcolor='rgba(252, 247, 245, 0.8)',
    paper_bgcolor='#FCF7F5'
)
return fig

server = app.server

3 Likes

Looks great! Just curious, what issues did you run into when publishing to Cloud?

2 Likes

Hello,

For instance, I was trying to change/edit this app’s name, “tranquil-turquoise-ladybug-2b4d8e38.plotly.app,” so in the end, I just left it as it was generated. I still don’t know how to do it.

The first time you build the app, it takes time, but once it’s created, it’s really fast—at least for this one with a small data size.

1 Like

Thank you @adamschroeder for the kind words. I am learning new things every week, and happy that you noticed. I just signed up for Plotly cloud and will deploy this app there in the next day or two. I look forward to sharing a link to it and showing it on the Friday call.

1 Like

Nice work @Avacsiglo21 on the app and deployment to Plotly Cloud. Can you please share or post your Requirements.txt file? I am working to deploy the app I submitted yesterday to Plotly Cloud, hope to have it up in the next day or two. Thank you.

1 Like

Thanks Mike, Of course this is the requeriments.txt

dash
plotly
pandas
numpy
scikit-learn
dash_bootstrap_components
gunicorn

also as Adam mentioned
in your app.py you have to set a line server=app.server

Anything else just let me know

2 Likes

Thank you @Avacsiglo21

1 Like

Exactly. Thanks @Avacsiglo21 .

@Mike_Purtell don’t forget gunicorn inside the requirements.txt. I forgot it once.

2 Likes

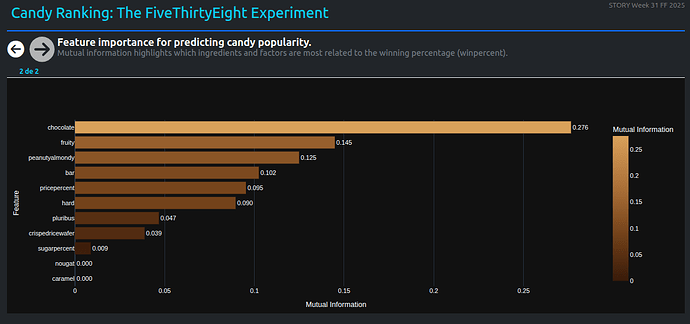
Hi, I found this topic very interesting, so I did an analysis using two different approaches: one to see how the candies relate to each other, and another to understand which features affect their popularity the most. This way, I can uncover important patterns that explain why some candies are more loved than others.

Application code

4 Likes

@U-Danny you always have such interesting graphs.
How did you build the first one?

Was there a specific pattern that you uncovered in the data?

2 Likes

The top chart is like a nice bracelet:)

3 Likes

Hi @adamschroeder, In the first chart, a graph based on similarities between candies is visualized, arranged in a circular layout, where the size of each node represents its popularity level and the color reflects its importance within the graph (PageRank). M&Ms (highlighted in red) stands out as the most central and connected candy, meaning it is not only highly popular but also a key reference against which many others are compared.
In the second chart, it shows how much each feature — like having chocolate, caramel, or a certain sugar content — influences the candies’ popularity. The longer bars indicate which attributes have a stronger relationship with taste.

2 Likes