Hello everyone,
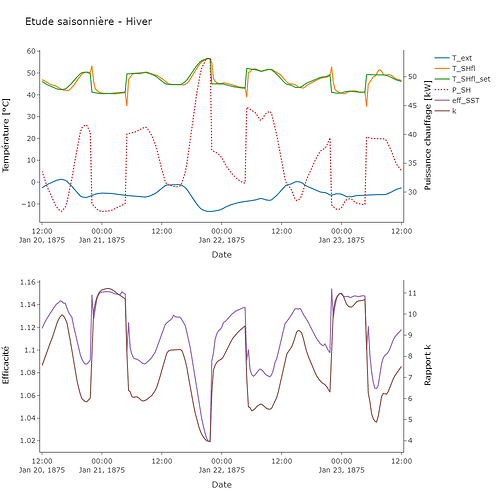
I have a little problem to format a graph on Plotly. Indeed, my dataframe has in index values of type DateTime which gives me dates on the x axis. The result suits me perfectly, except that I would like the year not to be displayed but keeping the same graduations (day and time) as on the graph already obtained.
I have already made several researches and tried some solutions without getting a satisfactory result…
import plotly.graph_objects as go
from plotly.subplots import make_subplotsfig = make_subplots(rows=2, specs=[[{“secondary_y”: True}],[{“secondary_y”: True}]])
Add traces
fig.add_trace(
go.Scatter(x=resul_active_winter_use.loc[period_winter].index,
y=resul_active_winter_use.loc[period_winter][‘T_ext’], name=“T_ext”),
secondary_y=False,row=1, col=1
)
fig.add_trace(
go.Scatter(x=resul_active_winter_use.loc[period_winter].index,
y=resul_active_winter_use.loc[period_winter][‘T_SHfl’], name=“T_SHfl”),
secondary_y=False,row=1, col=1
)
fig.add_trace(
go.Scatter(x=resul_active_winter_use.loc[period_winter].index,
y=resul_active_winter_use.loc[period_winter][‘T_SHfl_set’], name=“T_SHfl_set”),
secondary_y=False,row=1, col=1
)fig.add_trace(
go.Scatter(x=resul_active_winter_use.loc[period_winter].index,
y=resul_active_winter_use.loc[period_winter][‘P_SH’], name=“P_SH”, line=dict(dash=‘dot’) ),
secondary_y=True,row=1, col=1
)fig.add_trace(
go.Scatter(x=resul_active_winter_use.loc[period_winter].index,
y=resul_active_winter_use.loc[period_winter][‘eff_SST’], name=“eff_SST”),
secondary_y=False,row=2, col=1
)
fig.add_trace(
go.Scatter(x=resul_active_winter_use.loc[period_winter].index,
y=resul_active_winter_use.loc[period_winter][‘k’], name=“k”),
secondary_y=True,row=2, col=1
)fig.update_layout(title=‘Etude saisonnière - Hiver’,
#xaxis_title=’% Variation’,
#yaxis_title=‘P_SST’,
#legend_font_size=18,
#xaxis_title=‘Temps [h]’,
#yaxis_title=‘Température [°C]’,
template=“simple_white”,
legend_title_text=’’,
font_size=14,
autosize=False,
width=1000,
height=1000,
margin=dict(
l=50,
r=50,
b=100,
t=100,
pad=4)
)fig.update_xaxes(title_text=“Date”)
fig.update_yaxes(title_text=“Température [°C]”, secondary_y=False, col=1, row=1)
fig.update_yaxes(title_text=“Puissance chauffage [kW]”, secondary_y=True, col=1, row=1)fig.update_yaxes(title_text=“Efficacité”, secondary_y=False, col=1, row=2)
fig.update_yaxes(title_text=“Rapport k”, secondary_y=True, col=1, row=2)#fig.update_xaxes(
#dtick=“M1”,
tickformat=“%d\n%b”)
fig.show()
If someone can bring me a solution I would be really grateful.
Thanks in advance,
Alexis
