I have created a timeline chart but I can’t seem to figure out how to replace the x axis to plot hours instead of days.
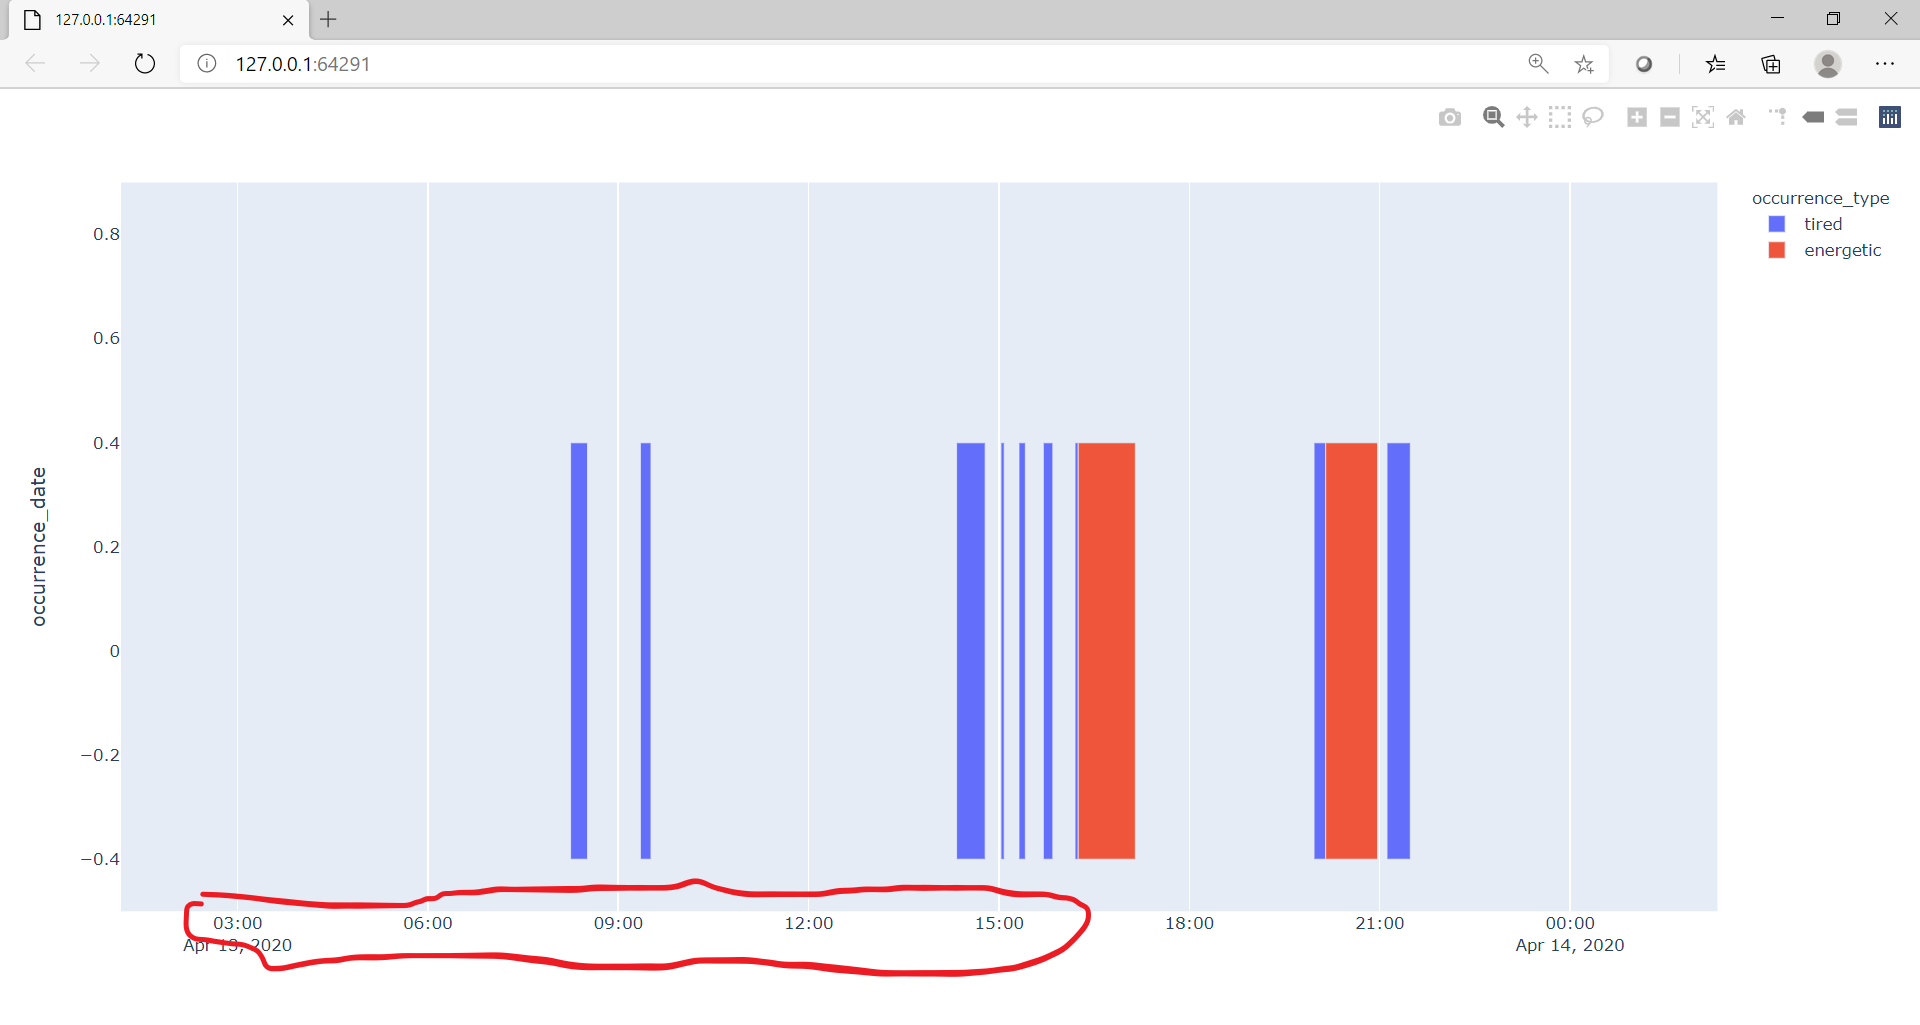
Instead of this x axis:
I’d like something like this:
Here’s the code and the link to the data to reproduce the figure:
import pandas as pd
import plotly.express as px

df = pd.read_csv("graph_data.csv")
df["start_timestamp"] = pd.to_datetime(df["start_timestamp"])
df["end_timestamp"] = pd.to_datetime(df["end_timestamp"])
df["occurrence_date"] = pd.to_datetime(df["occurrence_date"]).dt.weekday

fig = px.timeline(df, x_start="start_timestamp", x_end="end_timestamp", y="occurrence_date",color="occurrence_type")
fig.show()
I tried using xaxis data type as linear but that didn’t work either.
Is there a way to set and consistently see x axis labels from 00:00 to 23:59?
Yes, you could use fig.update_xaxes(tickformat="...") with whatever format you’re looking for, and/or you could customize tickformatstops. Both are documented here: https://plotly.com/python/time-series/
Thinking on this some more: if you want all the 1 o’clocks to line up, regardless of the date, then things are a bit more complicated… Date axes represent actual identifiable absolute instants in time like “1 o’clock on April 13th”, so all you can do in this case is normalize all times to a specific date e.g. Jan 1, 1970, which is the beginning of the unix epoch, and then force the date axis to show only times and not dates using tickformat.
Thanks Nick,
your second suggestion helped me solve it after I changed all start dates and end dates to the same year, month, and day. Here’s the code:
import pandas as pd
import plotly.express as px

df = pd.read_csv("graph_data.csv")
df["start_timestamp"] = pd.to_datetime(df["start_timestamp"])
df["start_timestamp"] = df["start_timestamp"].apply(lambda x: x.replace(year=1970, month=1, day=1))
df["end_timestamp"] = pd.to_datetime(df["end_timestamp"])
df["end_timestamp"] = df["end_timestamp"].apply(lambda x: x.replace(year=1970, month=1, day=1))

df["occurrence_date"] = pd.to_datetime(df["occurrence_date"]).dt.weekday


fig = px.timeline(df, x_start="start_timestamp", x_end="end_timestamp", y="occurrence_date",color="occurrence_type")
fig.update_xaxes(
    tickformat="%H\n%M",
    tickformatstops=[
        dict(dtickrange=[3600000, 86400000], value="%H:%M")]  # range is 1 hour to 24 hours
)
fig.show()
And this is the beautiful result:
Thank you,
hey @nicolaskruchten and @adamschroeder can we plot nanoseconds information on X axis , what i mean can we pass an array like [10,15,20,45,100] and then get plot based on this array on X axis, if possible please help?
But using the dates as new values on x axis I am not getting values beyond 4 lakh but i want to go more than that , for now i am converting number to days in this way , please suggest some way to go to higher numbers on X axis
def convert_to_datetime(x):
return datetime.fromtimestamp(31536000+x243600).strftime("%Y-%m-%d")