This month’s community challenge is all about fraud detection. The challenge is to build a Dash app that offers data visualization around credit card usage and a prediction element for which transactions are likely to be fraud. In addition, participants are encouraged to integrate Large Language Models into their app for further insights.
Please use the fraudTrain.csv dataset found on kaggle for this challenge.
This is a big dataset – feel free to use Plotly Resampler to enhance your visualizations.
The winning apps will be judged according to the following categories:
Usage of Plotly graphs
App Design (layout, style, ease of use)
Data exploration and data analysis routines (e.g. numerical methods, machine learning, prediction, classification, optimization)
Integration and quality of LLM with the app
The winners will be announced in the next Dash Club dispatch and will receive a reward of:
$125 USD
$75 USD
$50 USD
To submit your app, share it by replying to this Forum topic by midnight Sunday, March 17. Please include a link to the app (if deployed), the code on GitHub, and a short description of the app.
For any questions, feel free to reply to the Forum topic or message me directly.
I am just replying to let people know that I am currently working on this, will update this post when it is finished.
Update: Unfortunately I am still working on the app with very complex functionalities and optimizations, I also started late and couldn’t make it within limited time. So I will not be part of the competition but will still post it once it is finished somewhere this week.
Better yet AIMPED , share an online stopwatch for the application cut-off.
Not directly related but how do I this : Node A flows to Node D with value 1,Node B flows to node D with value 2,Node D must flow with value 3 to somewhere or throw a warning.
This is my first time using Dash and Machine Learning in any project, and after this challenge, I’ve discovered extremely interesting tools that I will continue learning.
Idea: When planning to visit any area, one would like to know about the frauds in and around the area. Hence here you go.
Click on the map present in the dashboard/application…vola you have your location.
Well sounds cool, something else need to be added is the news about the area, still pending though. But the idea is to get fraudulent based news around.
Once all this is captured using location and news, would use LLM to summarise it.
Lastly, the below section looks into transactions to be accessed using merchant, category, amount, gender and job of an individual.
Oh yeah: The data science stuff → Can be found here.
Cleaned up the job and merchant columns
Build a pipeline to train and test the model
Model used: OneHotEncoder and XGBClassifier
Category selection - Various categories selected
Number of frauds - Total frauds in that particular category
World map - Amount of each category using latitude and longitude
Fraud count - Visualisation for fraud count based on category selected above
Evaluation of a transaction whether fraudulent or not fraudulent.
Lastly, its fun to use plotly dash, dash bootstrap and callbacks
Also anyone, playing around the notebook feel free to give a follow on github
Thank you for participating in the Fraud Detection App Challenge. The Plotly staff members who judged the apps were thrilled to see the apps you built.
After some good deliberation, we decided to grant first place to…
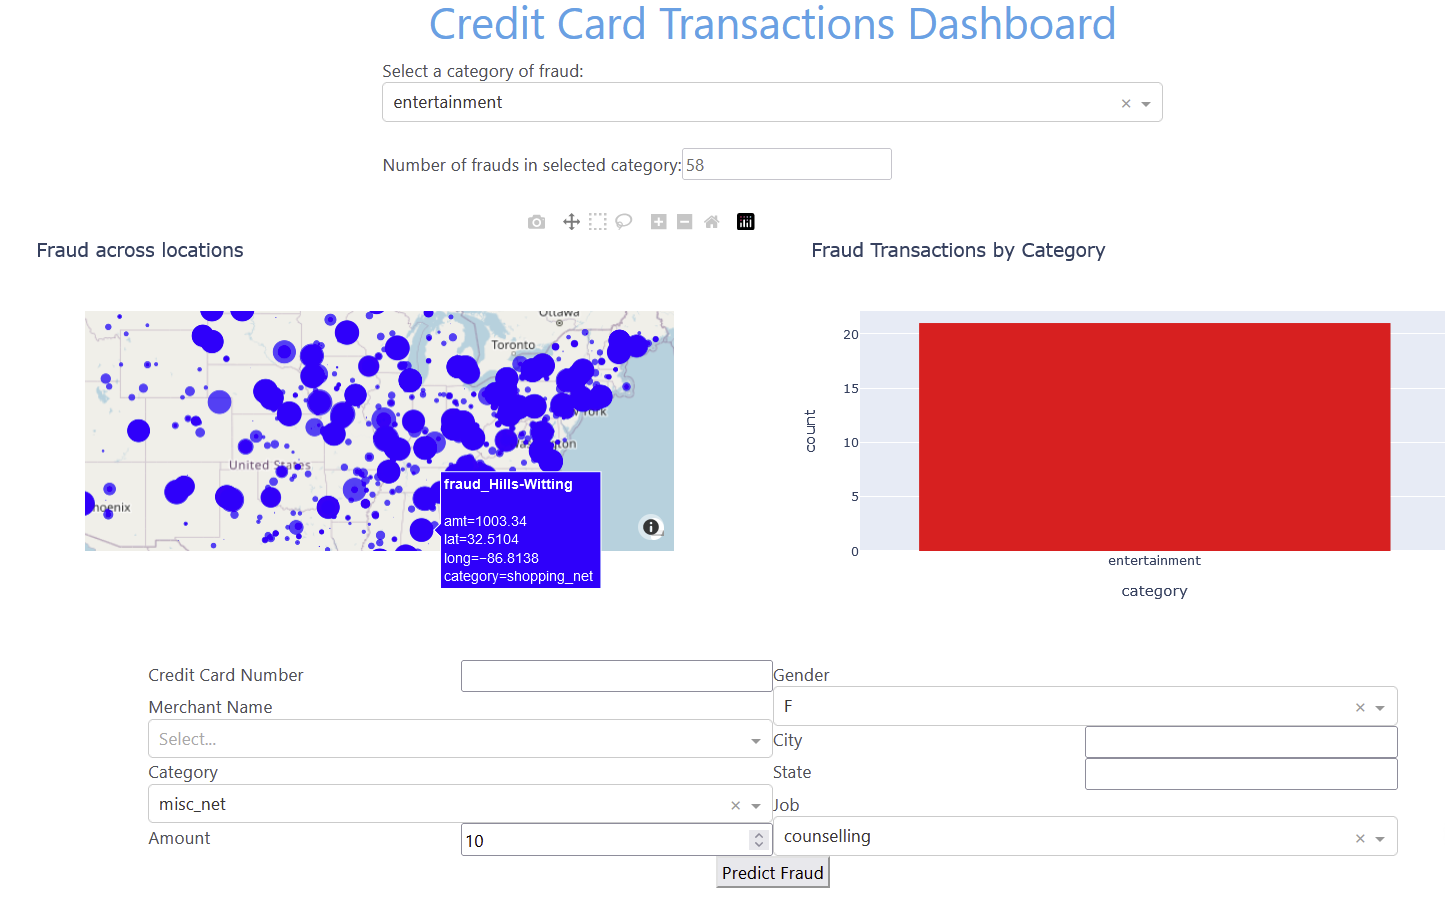
Credit Card Transactions Dashboard, created by Rishi, with the following code.
Combining the power of Plotly Dash with Machine Learning (XGBClassifier), Rishi was able to build an app that summarizes the total number and location of frauds within a particular category.
It also allows the user to try to predict fraud based on filters such as merchant name, category, city, gender and job of an individual.
Kudos for putting the whole app on one page. No need to explore other tabs or scroll up and down. All the functionalities of this app are easily accessible at a glance.
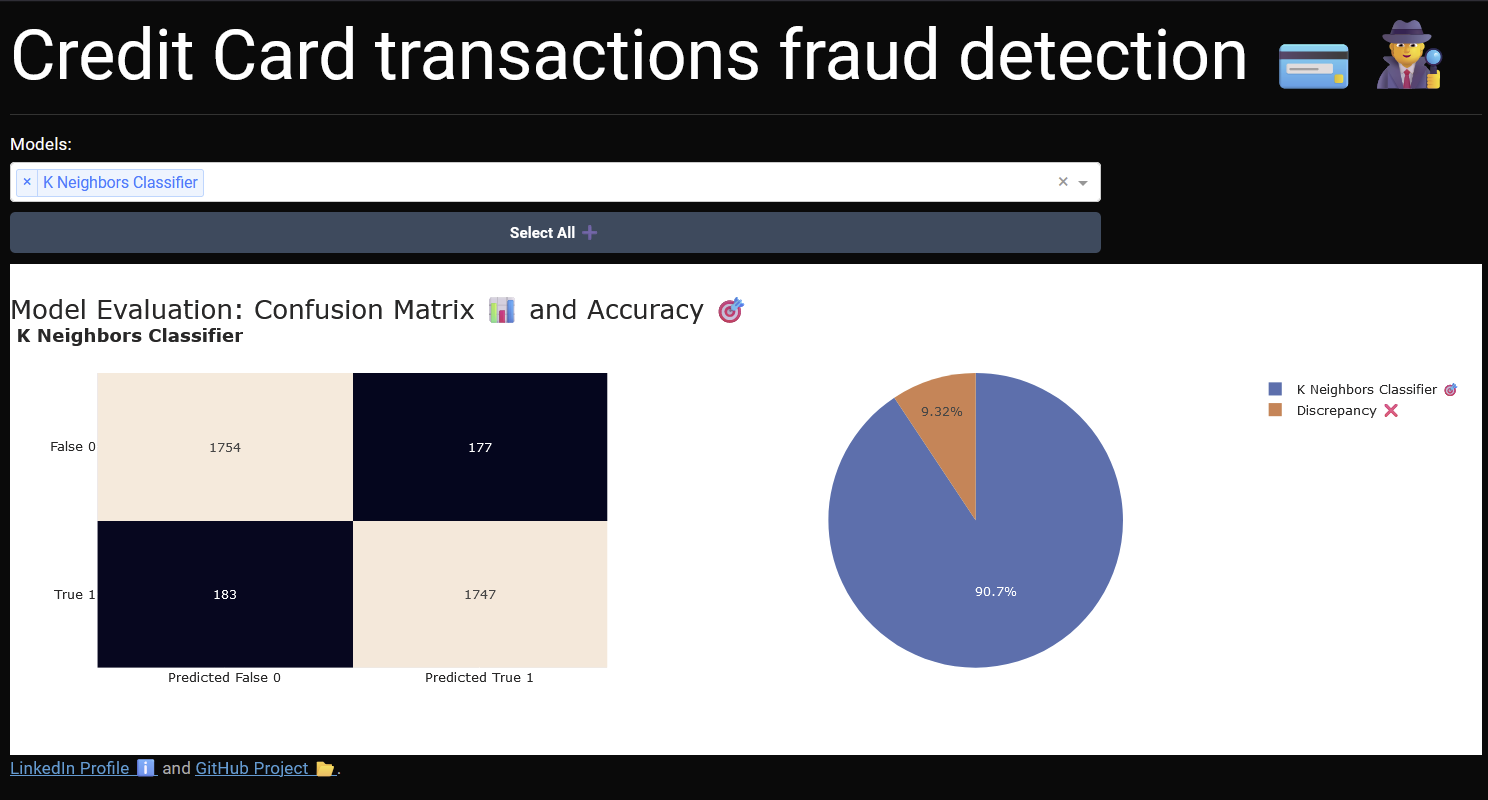
Fraud Detection Dash App, created by Pablo, with the following code.
Using Machine Learning and Plotly Dash techniques, Pablo’s app offers a quick analysis of the credit card fraud transaction dataset.
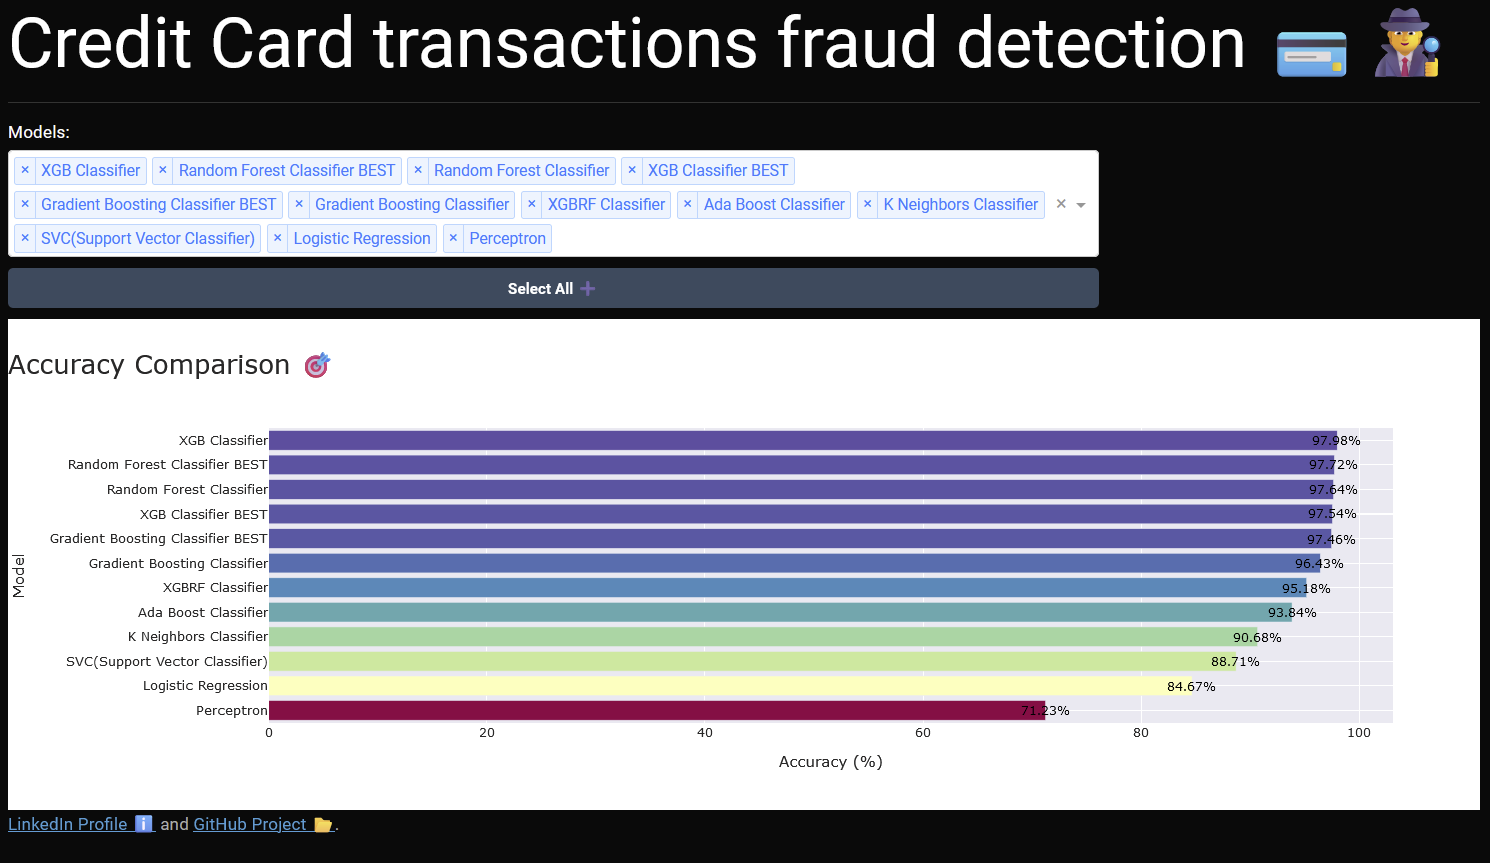
We loved how this app highlights a performance comparison between the different machine learning models used for fraud prediction.
If you select only one dropdown value, you’ll get a breakdown in performance for the respective model, using Confusion Matrix and Accuracy.