AWS elasticbeanstalk deployment of dash app getting stuck loading

I created a dash application in python, and everything runs fine on my local virtual environment.

When I try to deploy it to elasticbeanstalk on AWS, I am having this issue where the page gets stuck loading the first time you click on the link. If you exit the page, and then return to the link, everything works fine. If I try to open the application in a private browser, or if I reload the application, I have this same issue.

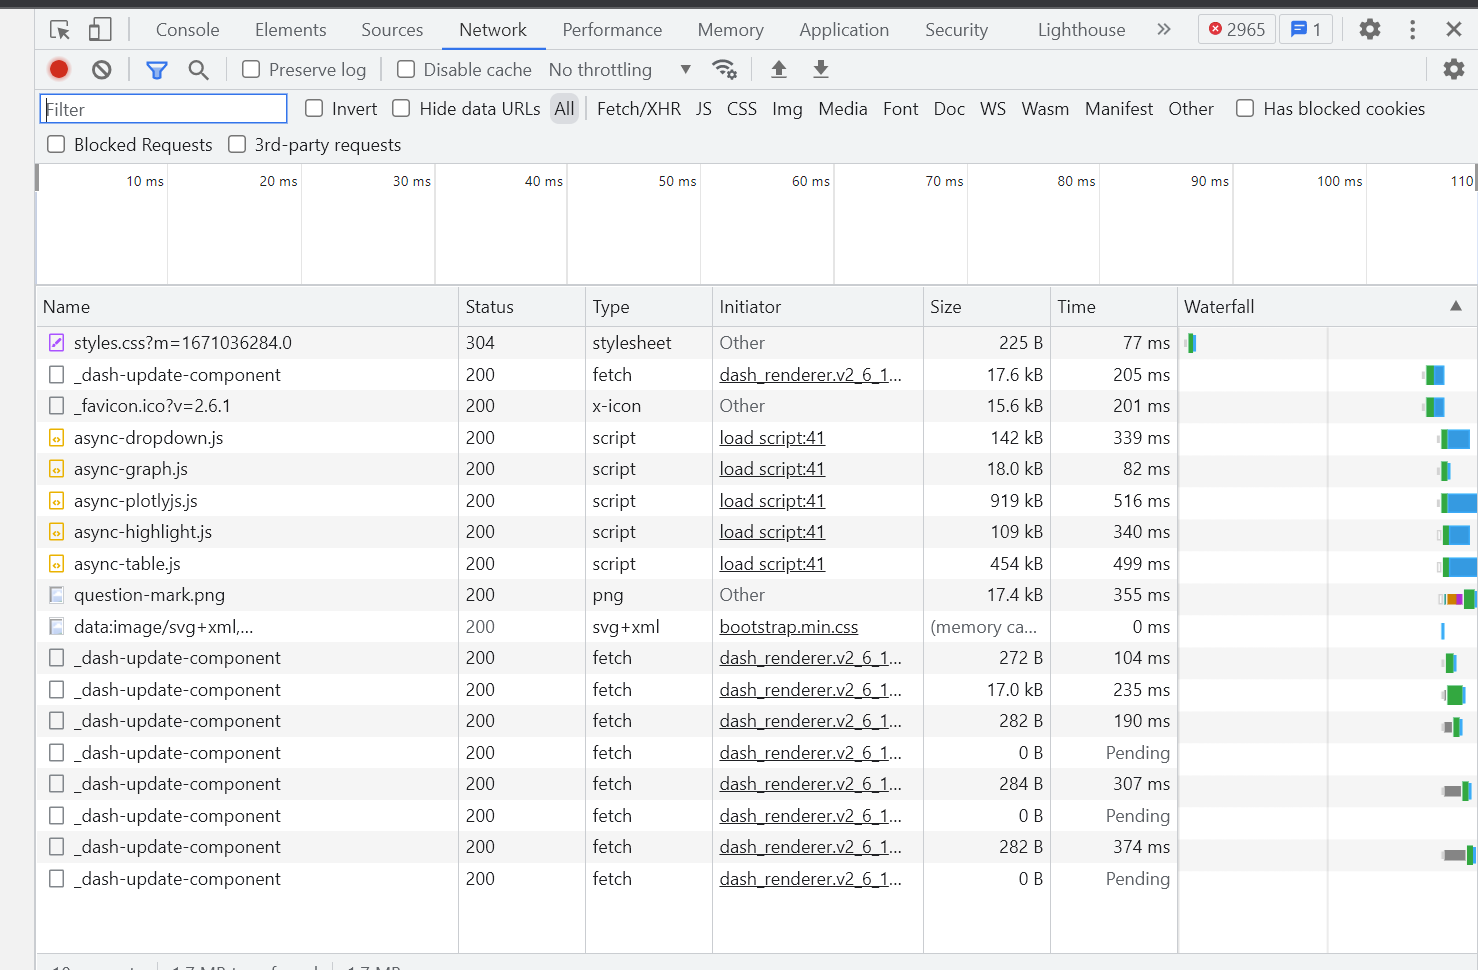
The app itself has around 5 different main pages, with around 2-10 callbacks per page. It is dynamically reading in csv’s stored in S3 buckets, and then slices the data depending on the callbacks (via dropdowns) and plotting them using the plotly express library.

I checked the error logs, and saw this warning pop up a couple of times. Could the issue be related to too much data being read in dynamically? I tried using the most basic AWS Free tier configuration, and then tried the High Availability configuration which contains a load balancer, and had the same issues and warning message with both.

2022/12/21 16:34:48 [warn] 3998#3998: *32 an upstream response is buffered to a temporary file /var/lib/nginx/tmp/proxy/2/00/0000000002 while reading upstream, client: 172.31.35.158, server: , request: “GET /_dash-component-suites/dash/dash_table/async-table.js HTTP/1.1”, upstream: “http://127.0.0.1:8000/_dash-component-suites/dash/dash_table/async-table.js”, host: “greendashtest-env.eba-a4mpr4jj.us-east-1.elasticbeanstalk.com”, referrer: “Dash”

Sometimes I get this error message if I let it load for long enough:

image

Would appreciate any help in troubleshooting this!

Thanks!

Hello @schavin,

Welcome to the community!

Looks like it is having an issue finding that file. When you navigate back to the page, do the dash tables load just fine after you click on the link for the first time?

Also, how long does it normally take your tables to render on the local computer?

When I navigate back to the page, the tables load fine after I click on the link for the first time.

On my local computer, they render pretty quickly (less than 2 seconds probably)

Hmm, check out this topic and see if any of this stuff can help you out:

It actually sounds like you may be encountering similar issues. Though I’m still not sure why you are encountering that file issue with dashtable.

It might just be because of how the whole setup works (mostly to save costs).
You could verify in AWS that there’s actually resources ready to serve your request and not needed to be allocated somehow, explaining the delay.

Also regarding loadbalancing and hitting the same server resource, you need to use sticky session which uses cookies. if you use a private session, you would not use the previous cookie or store anything i guess. so the loadbalancing to any “hot / available” resource will not be working and AWS will spin up a new resource for your request… explaining the whole problem of the initial resource delay

Thanks all for these responses!

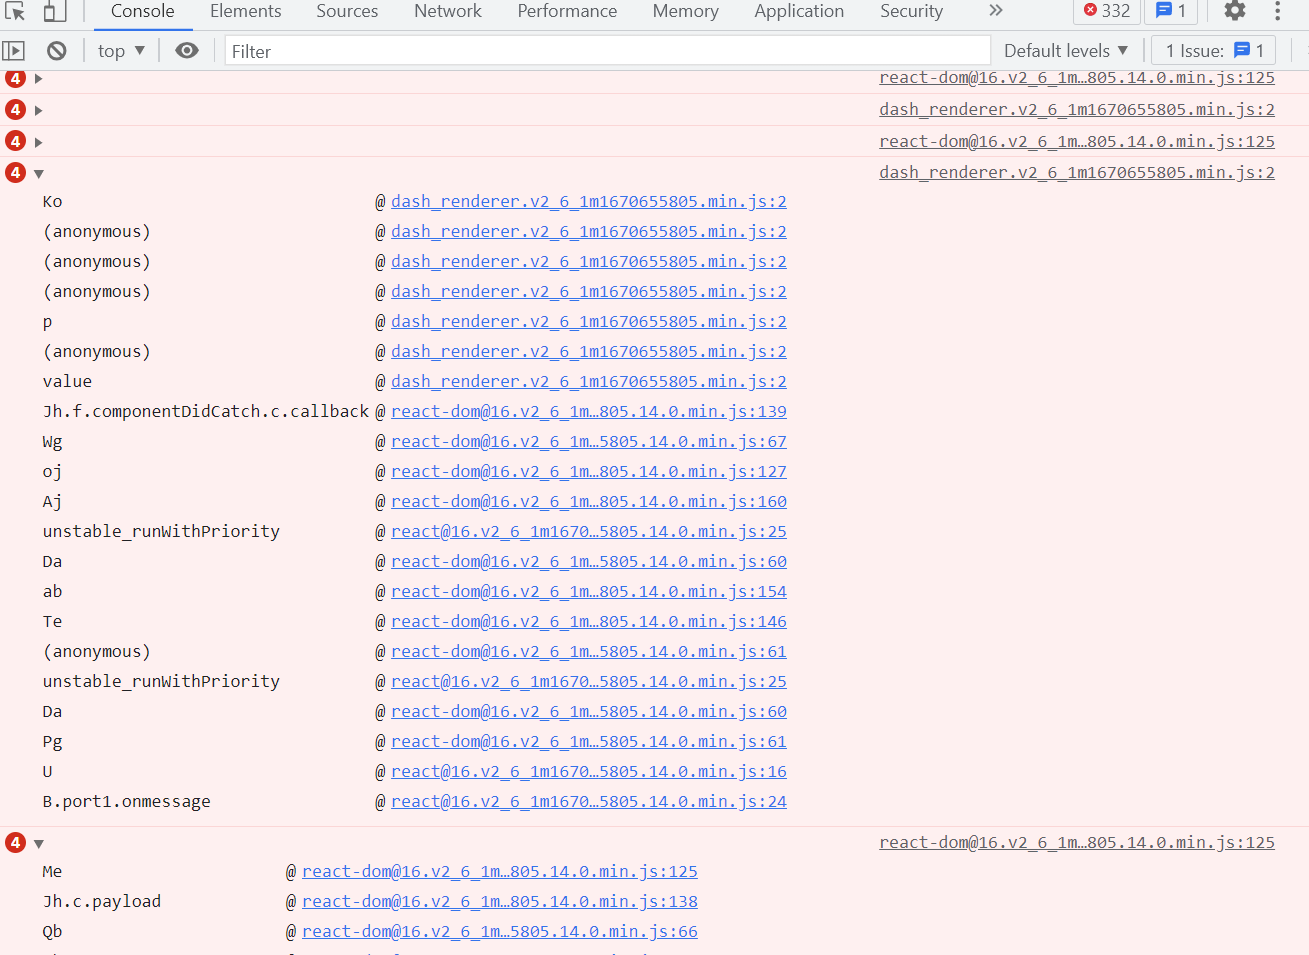
I tried opening the developer console, and it looks like there are some looping errors happening that are leading to a stack overflow error. Does anyone know what could be causing these?

What does the network tab say?

This is what the network tab is saying

In that image, had you clicked any buttons?

Do you have any intervals set up?

I had not clicked any buttons.

What do you mean by intervals? I don’t think I have any set up.

Alright, do you need any of your callbacks to fire immediately?

If not, put these in your callbacks to keep them from triggering right at the start:

prevent_initial_call=True

does it matter whether or not he uses the multiplexer extension?

It shouldnt really matter, it looks like maybe the network is getting spammed when first loading and becomes unresponsive. :slight_smile:

I just saw the following error message pop up in the developer console while debugging things locally. Any ideas on what could be happening here?

react_devtools_backend.js:4012 Warning: Can’t perform a React state update on an unmounted component. This is a no-op, but it indicates a memory leak in your application. To fix, cancel all subscriptions and asynchronous tasks in the componentWillUnmount method.

Hello @schavin,

It probably means that you are performing a callback on something that isn’t mounted.

Did you try prevent_initial_call=True on your callbacks?

I tried setting prevent_initial_call=True on my callbacks, and am still seeing the same stack size exceeded. I am also seeing the following errors:

Is there any way that you can post your code so that we can run it?

Use the <> button to wrap the code. :grin:

I think I have isolated the issue to this section of my code. When I set ‘display’:‘none’ for the Div containing a dash data table, the max call stack issue occurs. If I do not set the display to be none, the app runs fine.

This is the section of code for the div causing the issues:

                html.Div(data_table(metric_name + '_table'),
                        id = metric_name + '_table_div',
                        style={'display':'none'}
                       ) 

data_table is a function that creates and styles a data table. It is defined as so:

<> def data_table(id_name):
return html.Div(dash_table.DataTable(id=id_name,
style_header={‘backgroundColor’: ‘#D8DDEB’,
‘fontWeight’: ‘bold’,
‘whiteSpace’: ‘normal’,
‘height’: ‘auto’,
},
style_cell={ ‘fontFamily’:‘sans-serif’,
‘width’:‘120px’},
style_data={
‘whiteSpace’: ‘normal’,
‘height’: ‘auto’,
},
style_table = {
‘overflowX’:‘auto’,
‘overflowY’:‘auto’,
‘maxHeight’:“400px”
},
export_format=“csv”,
style_cell_conditional = [
{
‘if’:{
‘column_type’:‘text’
},
‘textAlign’:‘left’
},
{
‘if’:{
‘column_type’:‘numeric’
},
‘textAlign’:‘right’
}
],
fill_width=False
),
className = ‘mx-auto’) <>

Looks like other people were discussing a similar issue here - [BUG] Maximum call stack size exceeded when using dash_table.DataTable with flex ¡ Issue #1775 ¡ plotly/dash ¡ GitHub

Sorry… </> button

@schavin,