Performamce issues: reading data from Azure storage

Hi all,

I have some performance issues with my dashboard, and I am a bit lost with all the options there are to solve this problem. I have read most of the documentation about performance, advanced callbacks etc. But like I said, I am not sure where to start with this. So I would like to ask a couple of questions, without going too much into detail with my code.
When I run the dash app locally -in this process I also load and read the data from Azure!- it is pretty quick and all is fine. However, when running the same app in a Docker container on Azure, the app is really slow. The same callbacks take around 8-10 times longer. I have a P1v2 app service plan.

At the moment I have an Azure storage container with a pickled csv file (I had some issues with reading csv files in general, but this works fine). This file is only around 5-10MB. So my first question is, what is the best way to load this data in?
From what I understand I have to bypass global variables. Also I want to load the data from Azure only once per session, to prevent traffic and costs. So I did the following: I created a hidden Div and the following callback

html.Div([id="load-data")
dcc.Store(id="store-data", storage_type="memory", data=[])

@callback(
    Output("store-data", "data"),
    Input("load-data", "children"))

def load_data_page_load(data):
    df = blob.read_blob_storage("file.pkl")
    return df.to_dict(orient="records")

Read blob storage is the following code:

def read_blob_storage(filename):

  blob_client = BlobClient.from_connection_string("endpoint string", fileupload', filename)
  downloader = blob_client.download_blob()
  blob_file = downloader.readall()
  blob_file = pickle.loads(blob_file)

  return blob_file

This hidden div is a trick I read on this forum and makes sure the callback is only fired once. The file is stored in a Store component. Again, I have no performance issues offline, so this loads quite fast.
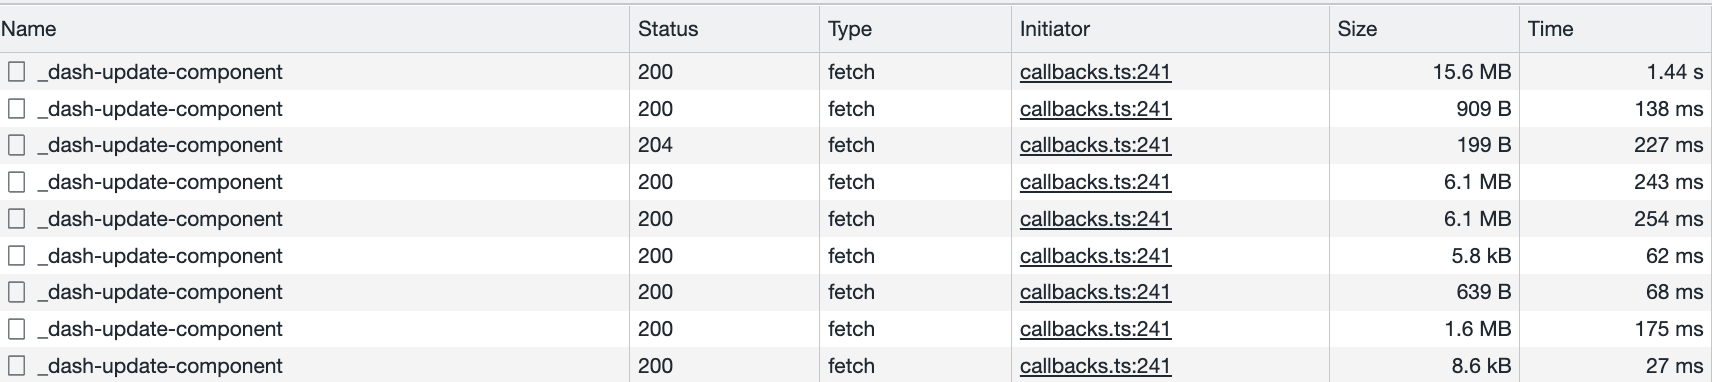
Locally this callback takes less than a second. On Azure this callback takes around 8 seconds.

Then, because I have multiple filters and inputs, I have multiple dcc.Store components (3 of them), which all contain a smaller portion of the dataframe. Is this bad practise? I have tried to think of a way to prevent this, but I have to update the Store multiple times, which isn’t allowed. Does this make the app slow maybe?

So this is high over how the app is designed, but maybe someone can point me in the right direction with this information.
I made sure that callbacks only update the dashboard when necessary and also have used prevent_initial_call=True for multiple callbacks.

Sorry for the long read and thank you for any tips and tricks!

Hello @JordyS,

Thank you for the long explanation.

When you run the web app locally, how many resources are you using? What’s your memory/CPU/Network traffic like? What resources have you allocated to the container CPU/Memory, etc. How fast can the container ping the Azure Storage?

If the network isnt an issue, can you give more resources to the container to test to see if you get a performance boots? If anything, this sounds like it could be a RAM issue, unless there is a lot of processing being used to convert the pickle file.

I wouldnt say that the use of multiple dcc.Stores is bad, you just have to be sure to watch out for the space on the client’s computer. Also, you dont want storage_type memory, you want session. Memory will clear any time the browser is refreshed. Which, technically, it would reload anyways from the div reloading.

Thank you for your help jinnyzor (as always).

If you don’t see any big problems with my set-up, I will have to dive into the Azure environment. I can’t answer it at the moment.
One thing I noticed is that traffic in and out can reach over 100/200MB when using the app for a minute or so, even though the file used is only 5 MB. But like I said, I’ll have to look into it.

When changing my Store type to session I get the error 'Failed to execute 'setItem' on 'Storage': Setting the value of 'store-data' exceeded the quota' (for all three of them), even though the file is just 5MB. And everything is working still fine, even with these errors.

Thanks again!

1 Like

Oh, that is interesting, I guess you can leave it as memory. With how your setup is currently configured, it will requery it anyways.

If the data transfer is too much, you could look into server-side caching as well. Which I fear may be the case if the processing is not the issue and it is indeed the file transfer.

On the network tab, locally when ran, how much data is transferred with the requests, you’ll be looking for something like this:

you could store your dataframes data in a dcc store object and use something like df.to_json and turn compression on. depending on the data i got like 1:10 compression. ofcourse you’re data needs to be serializable.

example

hist_data = df.to_json(date_format='iso', orient='split', date_unit='ns', compression='gzip')
hist = pd.read_json(hist_data, orient='split',compression='gzip')

Also, i’m not sure if it does a lot, but you can also turn compression on in your dash app itself.

Compression can also take up computing power, so that’s something to watch out for too.

Yes, true, but mostly this can be neglected, in comparison to other data conversion items. in my personal experience a lot a date time stuff eats up time

Thank you, I didn’t think of checking it out like this.

The first callback (loading the data in), 15MB is transferred.
The second callback (selecting a template which filters the dataframe) always fires twice for some reason (2x 6MB in this case). I’m not sure why (yet).
Callbacks after that don’t use a lot of data. Also it is very quick like this, as you may have noticed :slight_smile:

Cheers

@JordyS,

15.6 mb is pretty hefty, you can try what @jcuypers suggested and give the compression a shot and see what happens. Another thing to keep in mind is server location as well, as this will effect your ping obviously.

Also, is there any way to access the logs of how long it takes between the request and response? You can print this to the python console to see if the process is taking any more time on the server side before sending the response back as well.

btw i saw an interesting way of logging / debugging with custom timings directly to the dash web debugger (not as advanced as profiling, but available when you need it).

check custom timings if you haven’t already :slight_smile:

1 Like