Plotly Studio is known as a product for generating data apps and dashboards in <2 minutes, but it’s also an amazing tool for just asking questions about your data.
Here are some examples from the built-in sample dataset.
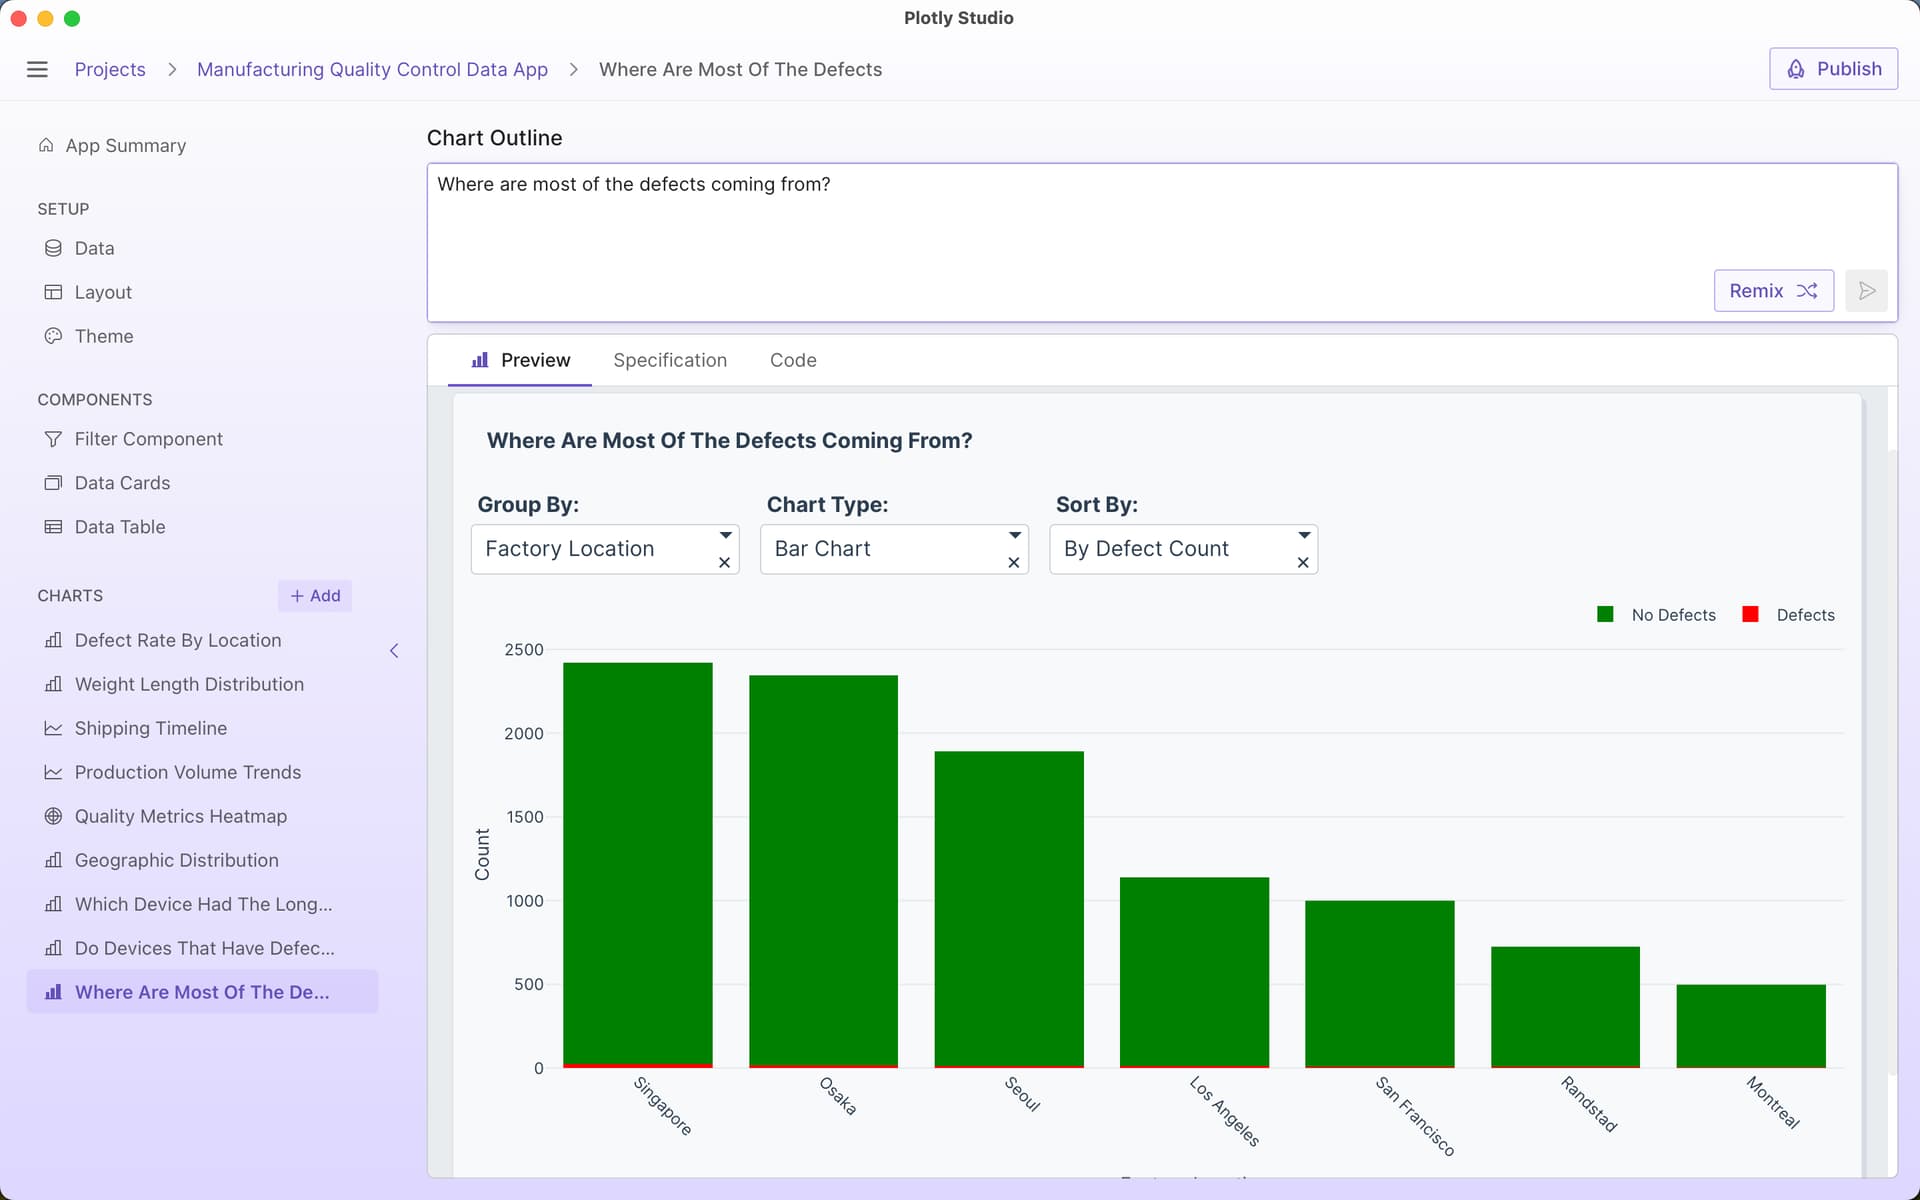
“where are most defects coming from?”
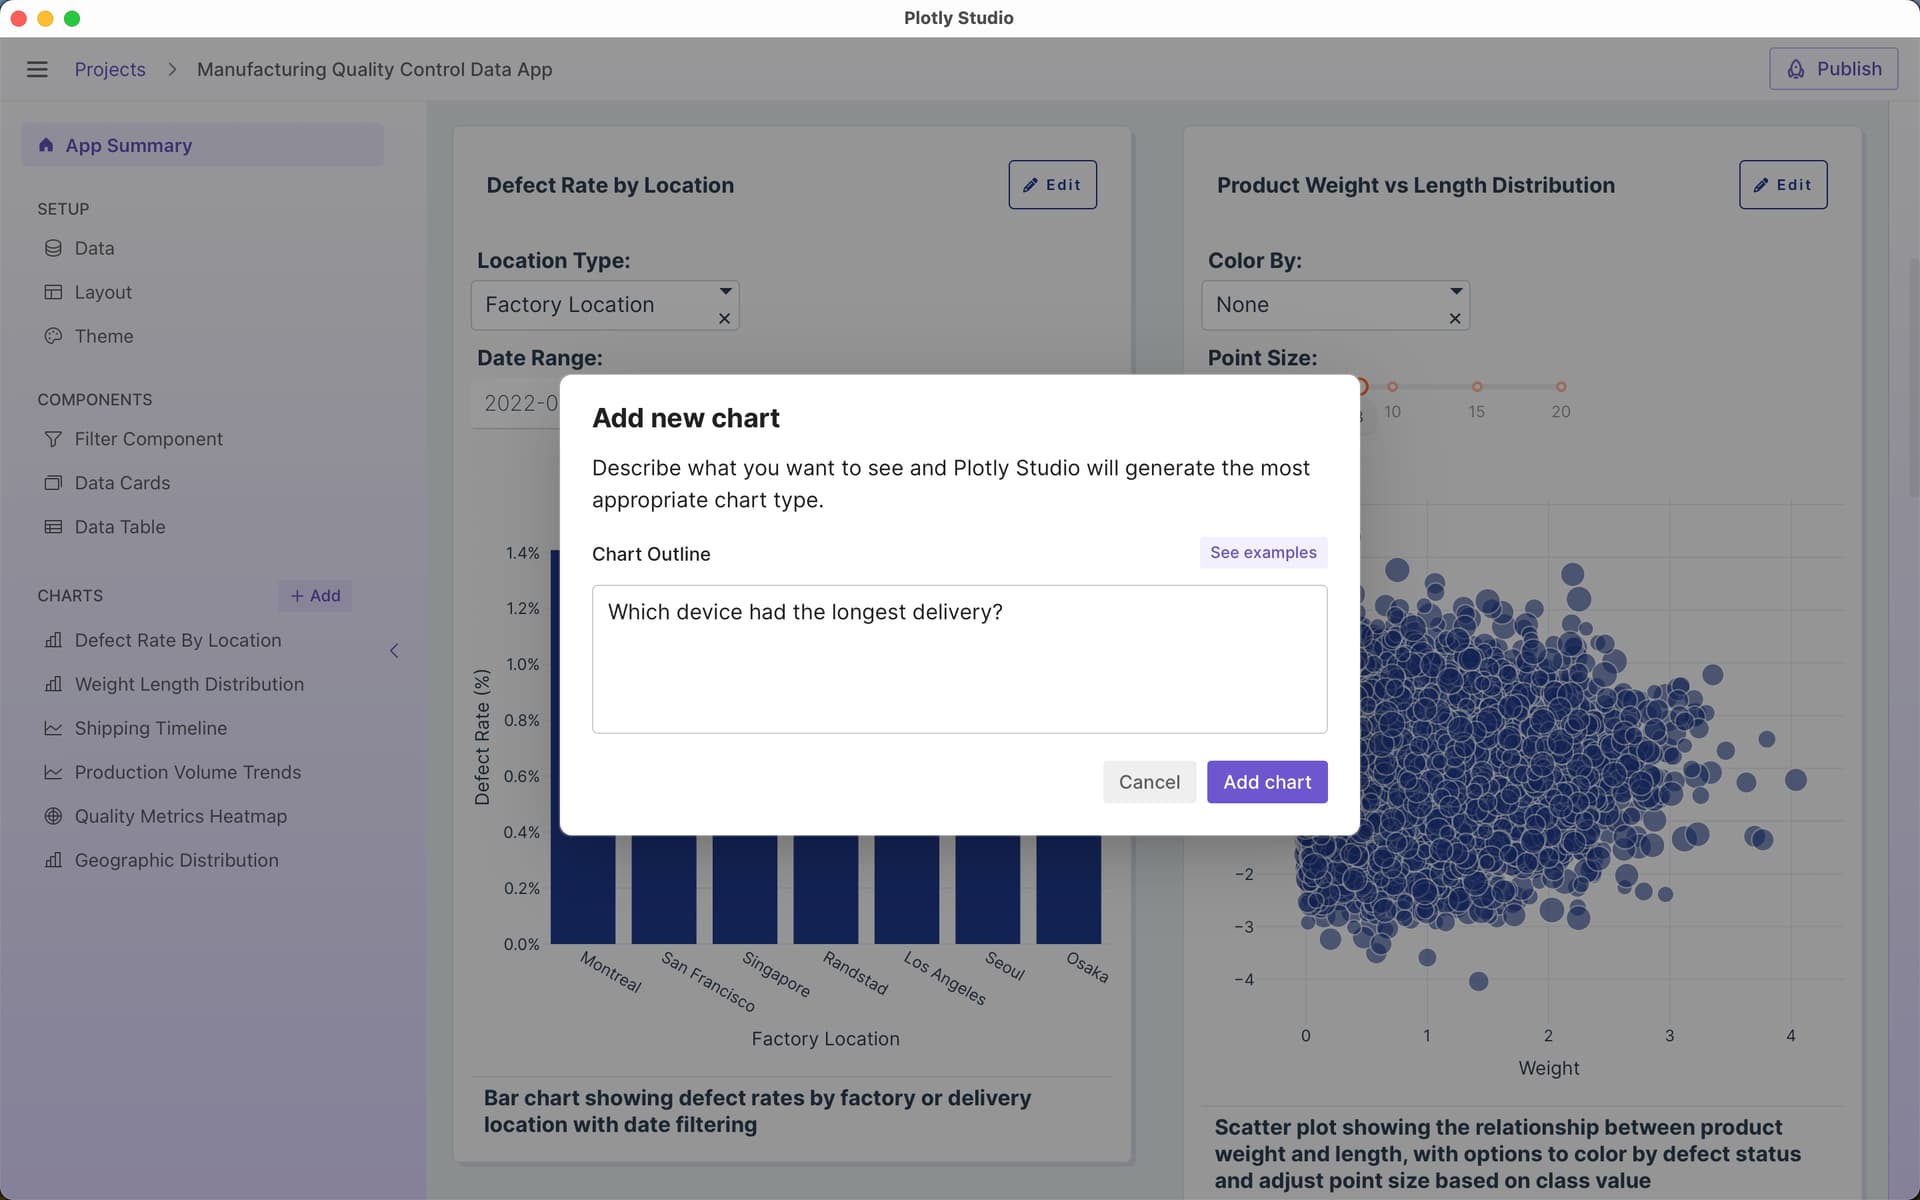
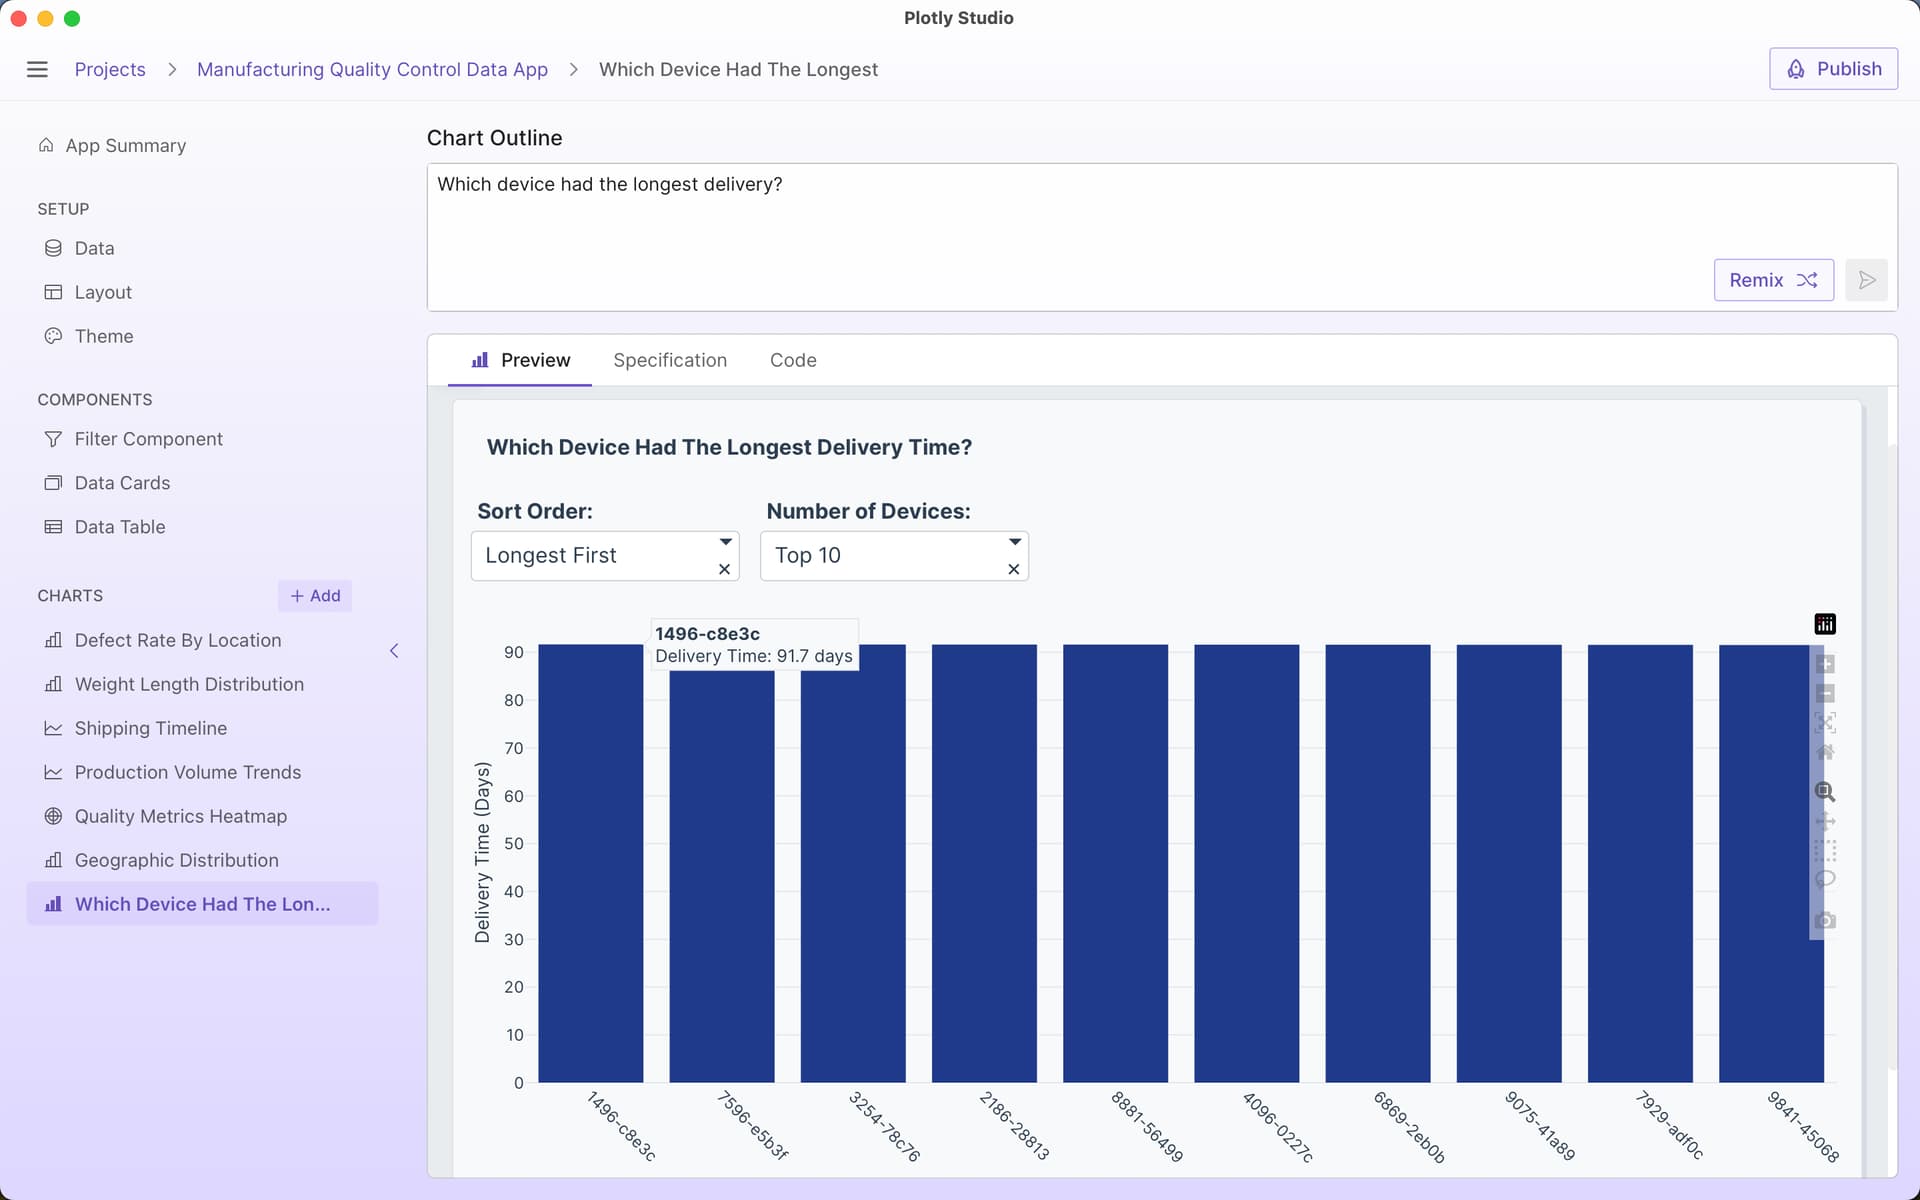
“which device had the longest delivery?”
Plotly Studio’s LLM will generate code that will do data analysis to answer my question and present the answer as a table or a chart:
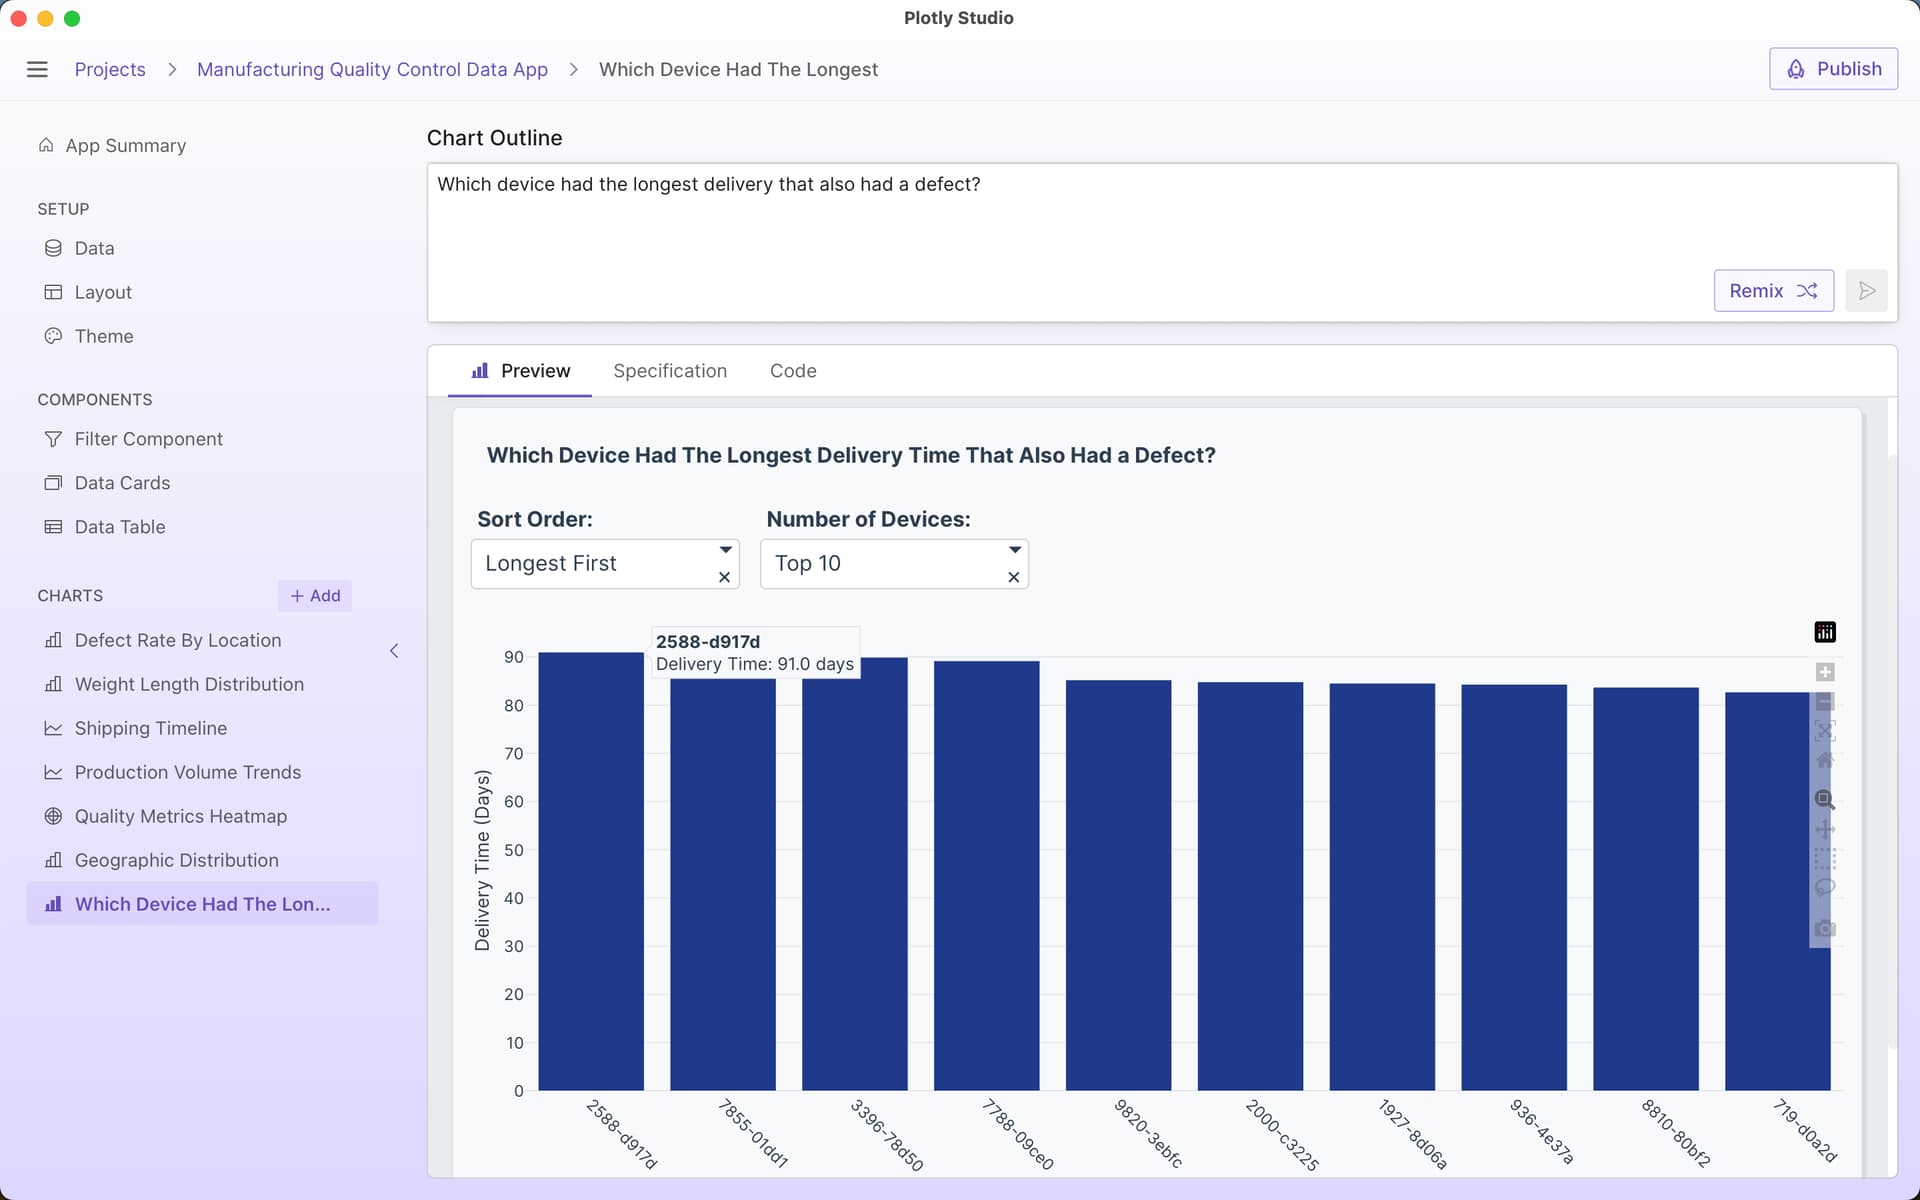
I can then ask follow up questions or refine my question in the chart outline and prompt. For example, I might refine my question to only include devices with defects:
Which device had the longest delivery that also had a defect?
I can change the output of the result to show me the answer as a table by region:
Which device had the longest delivery that also had a defect?
Show result as a set of tables by regions.

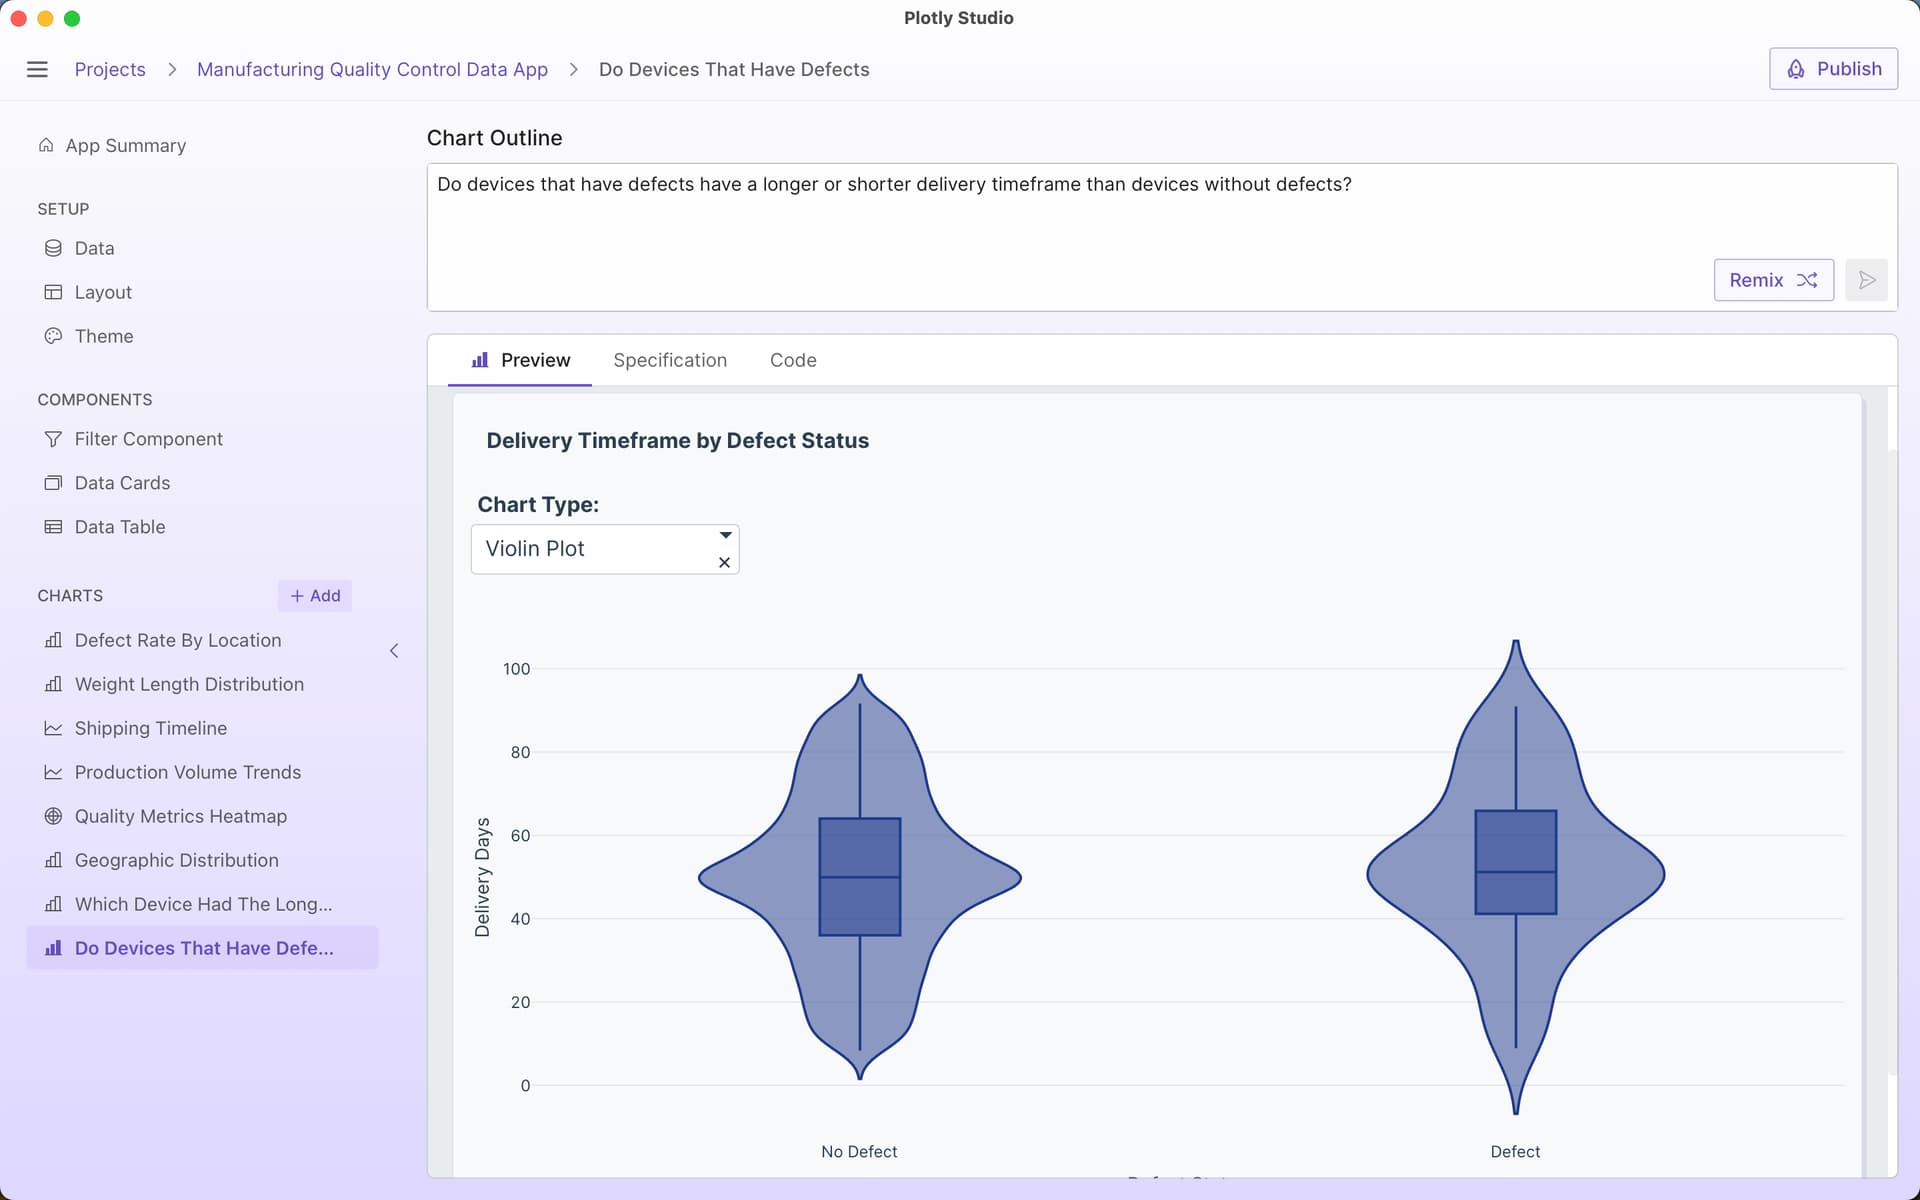
Plotly Studio is great at providing an answer to open ended questions without needing to specify exact chart types or parameters. For example, when asking “Do devices that have defects have a longer or shorter delivery timeframe than devices without defects?”, Plotly Studio presents the answer as a violin plot that I can interpret myself and see lots of other information about the dataset (the spread, the outliers, the median). My original question was actually ambiguous - do I want to know if the average time was longer or the median or the overall spread of values? A violin plot gives all of the answers:
Plotly Studio is an AI-native product, so it excels at these types of natural language Q&A. But we also designed and architected it in a way to get around a few of the pitfalls that you might see in other AI chatbots:
- Plotly Studio uses LLMs to generate analytics code to answer your question - Plotly Studio has a Python runtime bundled within the product. When you ask it a question about the data, it uses an LLM to generate Python code that will process the data and present the results of the analysis to you as a chart or a table for you to interpret. This is very different than asking an LLM for the answer directly based off of the dataset: LLMs don’t do data analysis directly (they predict tokens) and are unable of doing the computational work of data analysis without hallucination - any chatbot that doesn’t have a computational engine behind it will generate errors when dealing with large datasets and non-trivial data analysis (or even trivial ones, like counting the number of Rs in strawberry).
- Answers as a chart or a table - Plotly Studio presents the results of your query as an interactive chart or table with controls to further analyze your query. A chart and a table shows you the real results of your data analytics script without any interpretation (or hallucination) of an LLM in between. By seeing a chart or a table, you can get much more context in your answer. For example, in the question I had above for “Which device had the longest delivery?” the chart revealed that many device IDs actually have the same delivery length.
- Combine multiple answers in to one app - Plotly Studio generates charts and tables that can be combined in to a single data app that can be shared as an interactive app online with a link. These apps (and “answers”) can be immediately shared with colleagues.
- Prompts not chats - Questions often lead to more questions with greater and greater detail. For example, I started my inquiry above asking about simple delivery times and then it evolved to asking solely about delivery times of devices with defects. As I refine these questions, all of the detail about my question remains within the prompt itself rather than a chat history. This user interface has a few huge advantages over a traditional chat-based interface:
a. Referencing later - It’s much easier to go back and look at your prompt rather than a long chat thread
b. Easy sharing - You can send your refined prompt to a colleague and they can tweak it to ask their own question without them needing to read through your chat transcript
c. Clear context - In long chat transcripts, LLMs can lose the details from earlier parts of the conversation. And long chats can contain contradicting information as the conversation evolves. By iterating on a single prompt, there is less context for the LLM and yourself to keep track of and the question can be very clear.
d. Re-run the question - As your data changes, you can rerun the question on new datasets to get updated analysis.