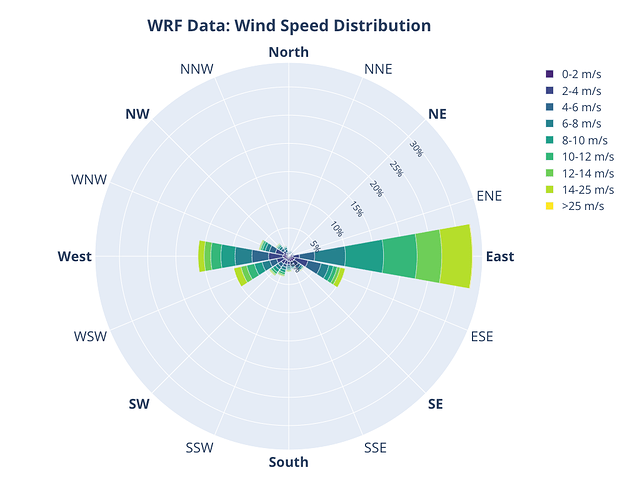
Here is my code, which appeared successful. I am also not a professional programmer, yet this code served me well and provided with a beautiful wind rose. I hope it helps anyone
Data prep:
import pandas as pd
import numpy as np
#%% function filtering the wind rose data based on the wind speed and direction (NEEDED BELOW)
def wind_dir_speed_freq(boundary_lower_speed, boundary_higher_speed, boundary_lower_direction, boundary_higher_direction):

    # mask for wind speed column
    log_mask_speed = (wind_rose_data[:,0] >= boundary_lower_speed) & (wind_rose_data[:,0] < boundary_higher_speed)
    # mask for wind direction
    log_mask_direction = (wind_rose_data[:,1] >= boundary_lower_direction) & (wind_rose_data[:,1] < boundary_higher_direction)

    # application of the filter on the wind_rose_data array
    return wind_rose_data[log_mask_speed & log_mask_direction]

#%% Wind rose

# Creating a pandas dataframe with 8 wind speed bins for each of the 16 wind directions.
# dataframe structure: direction | strength | frequency (radius)

wind_rose_df = pd.DataFrame(np.zeros((16*9, 3)), index = None, columns = ('direction', 'strength', 'frequency'))

directions = ['N', 'NNE', 'NE', 'ENE', 'E', 'ESE', 'SE', 'SSE', 'S', 'SSW', 'SW', 'WSW', 'W', 'WNW', 'NW', 'NNW']
directions_deg = np.array([0, 22.5, 45, 72.5, 90, 112.5, 135, 157.5, 180, 202.5, 225, 247.5, 270, 292.5, 315, 337.5])
speed_bins = ['0-2 m/s', '2-4 m/s', '4-6 m/s', '6-8 m/s', '8-10 m/s', '10-12 m/s', '12-14 m/s', '14-25 m/s', '>25 m/s']

# filling in the dataframe with directions and speed bins
wind_rose_df.direction = directions * 9
wind_rose_df.strength = np.repeat(speed_bins, 16)

#creating a multiindex dataframe with frequencies

idx = pd.MultiIndex.from_product([speed_bins,
                                  directions_deg],
                                 names=['wind_speed_bins', 'wind_direction_bins'])
col = ['frequency']
frequencies_df = pd.DataFrame(0, idx, col)

wind_rose_data = meteo[['wind_speed_m/s', 'wind_direction_deg']].to_numpy()

# distance between the centre of the bin and its edge
step = 11.25

# converting data between 348.75 and 360 to negative
for i in range(len(wind_rose_data)):
    if directions_deg[-1] + step <= wind_rose_data[i,1] and wind_rose_data[i,1] < 360:
        wind_rose_data[i,1] = wind_rose_data[i,1] - 360

# determining the direction bins
bin_edges_dir = directions_deg - step
bin_edges_dir = np.append(bin_edges_dir, [directions_deg[-1]+step])

# determining speed bins ( the last bin is 50 as above those speeds the outliers were removed for the measurements)
threshold_outlier_rm = 50
bin_edges_speed = np.array([0, 2, 4, 6, 8, 10, 12, 14, 25, threshold_outlier_rm])

frequencies = np.array([])
# loop selecting given bins and calculating frequencies
for i in range(len(bin_edges_speed)-1):
    for j in range(len(bin_edges_dir)-1)
        bin_contents = wind_dir_speed_freq(bin_edges_speed[i], bin_edges_speed[i+1], bin_edges_dir[j], bin_edges_dir[j+1])

        # applying the filtering function for every bin and checking the number of measurements
        bin_size = len(bin_contents)
        frequency = bin_size/len(wind_rose_data)

        #obtaining the final frequencies of bin
        frequencies = np.append(frequencies, frequency)

# updating the frequencies dataframe
frequencies_df.frequency = frequencies*100 # [%]
wind_rose_df.frequency = frequencies*100 # [%]

# calling the PLOT function
"""
PLOTTING THE ROSES
"""
fig_wind_rose = wind_rose_fig(frequencies_df,
                               title = '<b>WRF Data: Wind Speed Distribution</b>',
                               filename= 'fig_wind_rose_WRF.png',
                               open_bool  = False)
The plotting function goes here:
import plotly.graph_objects as go
from plotly.offline import plot

def wind_rose_fig(frequencies_df, title, filename, open_bool):
    fig = go.Figure()

    fig.add_trace(go.Barpolar(
        r=frequencies_df.loc[('0-2 m/s'), 'frequency'],
        name='0-2 m/s',
        marker_color='#482878'))

    fig.add_trace(go.Barpolar(
        r=frequencies_df.loc[('2-4 m/s'), 'frequency'],
        name='2-4 m/s',
        marker_color='#3e4989'))

    fig.add_trace(go.Barpolar(
        r=frequencies_df.loc[('4-6 m/s'), 'frequency'],
        name='4-6 m/s',
        marker_color='#31688e'))

    fig.add_trace(go.Barpolar(
        r=frequencies_df.loc[('6-8 m/s'), 'frequency'],
        name='6-8 m/s',
        marker_color='#26828e'))

    fig.add_trace(go.Barpolar(
        r=frequencies_df.loc[('8-10 m/s'), 'frequency'],
        name='8-10 m/s',
        marker_color='#1f9e89'))

    fig.add_trace(go.Barpolar(
        r=frequencies_df.loc[('10-12 m/s'), 'frequency'],
        name='10-12 m/s',
        marker_color='#35b779'))

    fig.add_trace(go.Barpolar(
        r=frequencies_df.loc[('12-14 m/s'), 'frequency'],
        name='12-14 m/s',
        marker_color='#6ece58'))

    fig.add_trace(go.Barpolar(
        r=frequencies_df.loc[('14-25 m/s'), 'frequency'],
        name='14-25 m/s',
        marker_color='#b5de2b'))

    fig.add_trace(go.Barpolar(
        r=frequencies_df.loc[('>25 m/s'), 'frequency'],
        name='>25 m/s',
        marker_color='#fde725'))

    fig.update_traces(text=['North', 'NNE', 'NE', 'ENE', 'East', 'ESE', 'SE', 'SSE', 'South', 'SSW', 'SW', 'WSW', 'West', 'WNW', 'NW', 'NNW'])

    fig.update_layout(
        title=title,
        title_font_size=26,
        title_x = 0.463,
        legend_font_size=18,
        polar_radialaxis_ticksuffix='%',
        polar_angularaxis_rotation=90,
        polar_angularaxis_direction='clockwise',
        polar_angularaxis_tickmode = 'array',
        polar_angularaxis_tickvals=[0, 22.5, 45, 72.5, 90, 112.5, 135, 157.5, 180, 202.5, 225, 247.5, 270, 292.5, 315, 337.5],
        polar_angularaxis_ticktext=['<b>North</b>', 'NNE', '<b>NE</b>', 'ENE', '<b>East</b>', 'ESE', '<b>SE</b>', 'SSE', '<b>South</b>', 'SSW', '<b>SW</b>', 'WSW', '<b>West</b>', 'WNW', '<b>NW</b>', 'NNW'],
        polar_angularaxis_tickfont_size = 22,
        polar_radialaxis_tickmode = 'linear',
        polar_radialaxis_angle = 45,
        polar_radialaxis_tick0 = 5,
        polar_radialaxis_dtick = 5,
        polar_radialaxis_tickangle = 100,
        polar_radialaxis_tickfont_size = 14)

    fig.write_image(get_fig_dir() + filename, width = 1000, height = 800)
    fig.show(renderer = 'png', width = 1000, height = 800)
    return plot(fig, auto_open = open_bool)


#%% histogram with wind directions
def histogram_wind_dir_fig(data, name, color, title, xaxis_title, yaxis_title, filename, open_bool):
    fig = go.Figure()
    fig.add_trace(go.Histogram(
    x=data,
    histnorm='percent',
    name=name, # name used in legend and hover labels
    xbins=dict( # bins used for histogram
        size=3),
    marker_color=color))


    fig.update_layout(
        title_text = title, # title of plot
        title_x=0.5,
        title_font_size = 24,
        xaxis=dict(title = xaxis_title,
                   titlefont_size=20,
                   tickfont_size=16,
                   tickvals=[0,30,60,90,120,150,180,210,240,270,300,330,360],
                   ticktext=['N',30,60,'E',120,150,'S',210,240,'W',300,330,'N']), # xaxis label
        yaxis=dict(title = yaxis_title,
                   titlefont_size=20,
                   tickfont_size=16), # yaxis label
        bargap=0.2,) # gap between bars of adjacent location coordinates

    fig.write_image(get_fig_dir() + filename, width = 1200, height = 500)
    fig.show(renderer = 'png', width = 1200, height = 500)
    return plot(fig, auto_open = open_bool)


 Thanks so much…
