Creating rose of wind

Hi,
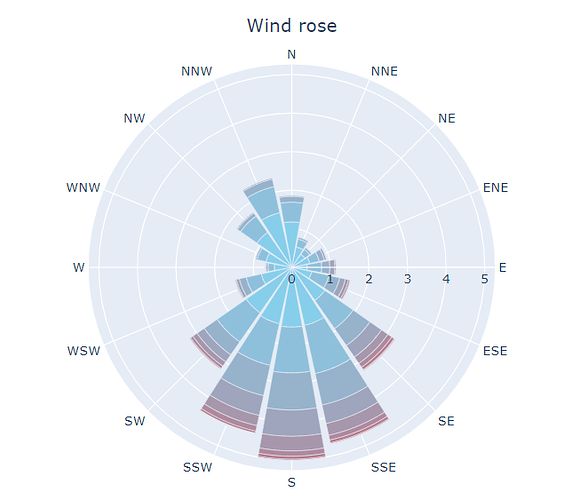
I would like to create a wind compass rose in Julia that would look like this one:

The compass rose is not a problem (I use barpolar) the only thing missing is the scale of speeds represented by colors, I did tests with colorscale, colorbar but I did not succeed…

trace = barpolar(r=Frequence, theta=direction, mode="lines",marker=attr(size=Frequence, sizeref=0.05, color=Vitesse))
    layout = Layout(
        title = attr(
          text = "Wind rose",
          x = 0.5,
          xanchor = "center"))
    plot(trace,layout)

BR
François

Hi @FrancoisFEM, this is python but JS should be pretty much the same:

Hi AIMPED,

Thanks for your answer, but it didn’t help me, my Python is pretty much rusty :smile: so I dont really understand your code :smiling_face_with_tear: … I have understand that the colorbar is a marker property, I have tryed

Couleurs = range(colorant"skyblue", stop=colorant"red", length=length(VitesseClasse))

trace = barpolar(r=Frequence, theta=direction, mode="lines",
    marker=attr(
        size=Frequence, 
        sizeref=0.05, 
        color=Vitesse,
        autocolorscale=false,
        colorscale=Couleurs,
        colorbar=attr(
            tickmode="array",
            tickvals=VitesseClasse[2:end] .- 1,
            ticktext=categories)))
    layout = Layout(
        title = attr(
          text = "Wind rose",
          x = 0.5,
          xanchor = "center"))
    plot(trace,layout)

But the result is not what I expect :


The color bar is display but not on the all set of values (0-2, 2-4, … 28-30) and without colors :wink:

following a MWE for 7 directions :

Frequence = [0.33177112545511583, 0.27283184242297487, 0.2148431929881266, 0.11502666527240407, 0.03707471029441123, 0.012358236764803741, 0.0009506335972925955, 0.001901267194585191, 0.001901267194585191, 0.0, 0.0, 0.0, 0.0, 0.0, 0.0, 0.0,
    0.40592054604393824, 0.28233817839590086, 0.1074215964940633, 0.05608738224026314, 0.010456969570218551, 0.0009506335972925955, 0.0, 0.0, 0.0, 0.0, 0.0, 0.0, 0.0, 0.0, 0.0, 0.0, 
    0.5095396081488313,0.20913939140437102, 0.09126082534008917, 0.013308870362096338, 0.0, 0.0, 0.0, 0.0, 0.0, 0.0, 0.0, 0.0, 0.0, 0.0, 0.0, 0.0,
    0.6445295789643798, 0.30705465192550835, 0.07795195497799283, 0.030420275113363055, 0.001901267194585191, 0.0, 0.0, 0.0, 0.0, 0.0, 0.0, 0.0, 0.0, 0.0, 0.0, 0.0,
    1.1692793246698925, 0.4857737682165163, 0.17396594830454498, 0.038975977488996415, 0.0, 0.0, 0.0, 0.0, 0.0, 0.0, 0.0, 0.0, 0.0, 0.0, 0.0, 0.0,
    1.466827640622475, 0.7063207627883985, 0.22339889536375995, 0.059889916629433514, 0.004753167986462978, 0.004753167986462978, 0.0, 0.0, 0.0, 0.0, 0.0, 0.0, 0.0, 0.0, 0.0, 0.0,
    1.0067209795328587, 0.557071288013461, 0.15970644434515605, 0.04658104626733718, 0.009506335972925956, 0.0009506335972925955, 0.0, 0.0, 0.0, 0.0, 0.0, 0.0, 0.0, 0.0, 0.0, 0.0]
direction = ["E", "E", "E", "E", "E", "E", "E", "E", "E", "E", "E", "E", "E", "E", "E", "E",
    "ENE", "ENE", "ENE", "ENE", "ENE", "ENE", "ENE", "ENE", "ENE", "ENE", "ENE", "ENE", "ENE", "ENE", "ENE", "ENE",
    "NE", "NE", "NE", "NE", "NE", "NE", "NE", "NE", "NE", "NE", "NE", "NE", "NE", "NE", "NE", "NE",
    "NNE", "NNE", "NNE", "NNE", "NNE", "NNE", "NNE", "NNE", "NNE", "NNE", "NNE", "NNE", "NNE", "NNE", "NNE", "NNE",
    "N", "N", "N", "N", "N", "N", "N", "N", "N", "N", "N", "N", "N", "N", "N", "N",
    "NNW", "NNW", "NNW", "NNW", "NNW", "NNW", "NNW", "NNW", "NNW", "NNW", "NNW", "NNW", "NNW", "NNW", "NNW", "NNW",
    "NW", "NW", "NW", "NW", "NW", "NW", "NW", "NW", "NW", "NW", "NW", "NW", "NW", "NW", "NW", "NW"]
    VitesseClasse = 0:2:30
    Couleurs = range(colorant"skyblue", stop=colorant"red", length=length(VitesseClasse))
    Vitesse = vcat([Couleurs for i = 1:7]...) 
    Couleurs = range(colorant"skyblue", stop=colorant"red", length=length(VitesseClasse))
    categories = ["$(VitesseClasse[Index]) - $(VitesseClasse[Index+1])" for Index in eachindex(VitesseClasse[1:end-1])]
    
    trace = barpolar(r=Frequence, theta=direction, mode="lines",
    marker=attr(
        size=Frequence, 
        sizeref=0.05, 
        color=Vitesse,
        autocolorscale=false,
        colorscale=Couleurs,
        colorbar=attr(
            tickmode="array",
            tickvals=VitesseClasse[2:end] .- 1,
            ticktext=categories)))
    layout = Layout(
        title = attr(
          text = "Wind rose",
          x = 0.5,
          xanchor = "center"))
    plot(trace,layout)

François

Haha, my JS is even worse! Maybe specifying the cmin, cmax arguments?

Hi,
I find a way, obviouslly not the best but the result is what I expect :slight_smile:

Frequence = [0.33177112545511583, 0.27283184242297487, 0.2148431929881266, 0.11502666527240407, 0.03707471029441123, 0.012358236764803741, 0.0009506335972925955, 0.001901267194585191, 0.001901267194585191, 0.0, 0.0, 0.0, 0.0, 0.0, 0.0, 0.0,
    0.40592054604393824, 0.28233817839590086, 0.1074215964940633, 0.05608738224026314, 0.010456969570218551, 0.0009506335972925955, 0.0, 0.0, 0.0, 0.0, 0.0, 0.0, 0.0, 0.0, 0.0, 0.0, 
    0.5095396081488313,0.20913939140437102, 0.09126082534008917, 0.013308870362096338, 0.0, 0.0, 0.0, 0.0, 0.0, 0.0, 0.0, 0.0, 0.0, 0.0, 0.0, 0.0,
    0.6445295789643798, 0.30705465192550835, 0.07795195497799283, 0.030420275113363055, 0.001901267194585191, 0.0, 0.0, 0.0, 0.0, 0.0, 0.0, 0.0, 0.0, 0.0, 0.0, 0.0,
    1.1692793246698925, 0.4857737682165163, 0.17396594830454498, 0.038975977488996415, 0.0, 0.0, 0.0, 0.0, 0.0, 0.0, 0.0, 0.0, 0.0, 0.0, 0.0, 0.0,
    1.466827640622475, 0.7063207627883985, 0.22339889536375995, 0.059889916629433514, 0.004753167986462978, 0.004753167986462978, 0.0, 0.0, 0.0, 0.0, 0.0, 0.0, 0.0, 0.0, 0.0, 0.0,
    1.0067209795328587, 0.557071288013461, 0.15970644434515605, 0.04658104626733718, 0.009506335972925956, 0.0009506335972925955, 0.0, 0.0, 0.0, 0.0, 0.0, 0.0, 0.0, 0.0, 0.0, 0.0]
    direction = ["E", "E", "E", "E", "E", "E", "E", "E", "E", "E", "E", "E", "E", "E", "E", "E",
    "ENE", "ENE", "ENE", "ENE", "ENE", "ENE", "ENE", "ENE", "ENE", "ENE", "ENE", "ENE", "ENE", "ENE", "ENE", "ENE",
    "NE", "NE", "NE", "NE", "NE", "NE", "NE", "NE", "NE", "NE", "NE", "NE", "NE", "NE", "NE", "NE",
    "NNE", "NNE", "NNE", "NNE", "NNE", "NNE", "NNE", "NNE", "NNE", "NNE", "NNE", "NNE", "NNE", "NNE", "NNE", "NNE",
    "N", "N", "N", "N", "N", "N", "N", "N", "N", "N", "N", "N", "N", "N", "N", "N",
    "NNW", "NNW", "NNW", "NNW", "NNW", "NNW", "NNW", "NNW", "NNW", "NNW", "NNW", "NNW", "NNW", "NNW", "NNW", "NNW",
    "NW", "NW", "NW", "NW", "NW", "NW", "NW", "NW", "NW", "NW", "NW", "NW", "NW", "NW", "NW", "NW"]
    VitesseClasse = 0:2:30
    Couleurs = range(colorant"skyblue", stop=colorant"red", length=length(VitesseClasse))[1:15]
    Vitesse = vcat([Couleurs for i = 1:7]...) 
    categories = ["[$(VitesseClasse[Index]) - $(VitesseClasse[Index+1])[" for Index in eachindex(VitesseClasse[1:end-1])]
    trace = Vector{GenericTrace{Dict{Symbol, Any}}}([])
    for (index,couleur) in enumerate(Couleurs)
        push!(trace,barpolar(r=zeros(length(direction)), theta=direction,
        display="legendonly",
        showlegend = true,
        legendgrouptitle = attr(text = "Wind speed [m/s]"),
        name=categories[index],
        marker=attr(color=Vitesse[index])))
    end
    push!(trace,barpolar(r=Frequence, theta=direction, mode="lines",
    showlegend = false,
    marker=attr(
        size=Frequence, 
        sizeref=0.05, 
        color=Vitesse)))
    layout = Layout(
        title = attr(
          text = "Wind rose",
          x = 0.5,
          xanchor = "center"),
          polar = attr(radialaxis = attr(showticklabels=true,ticksuffix = "%", showticksuffix ="last", title = "Frequency"),) )
    plot(trace,layout)

and the result :

1 Like