Hi all, I seem to be having some issues plotting a map. Please bear with me, as I am new to this.
I’d like to take some company sales data and make a choropleth (and eventually a bubble map) to show which counties in Ireland are our most active in terms of sales. I am able to merge the shapefiles for the Republic of Ireland and Northern Ireland into one dataset so that I capture sales across our fair island, but my issue stems from the fact that I have more than one data point for some counties.
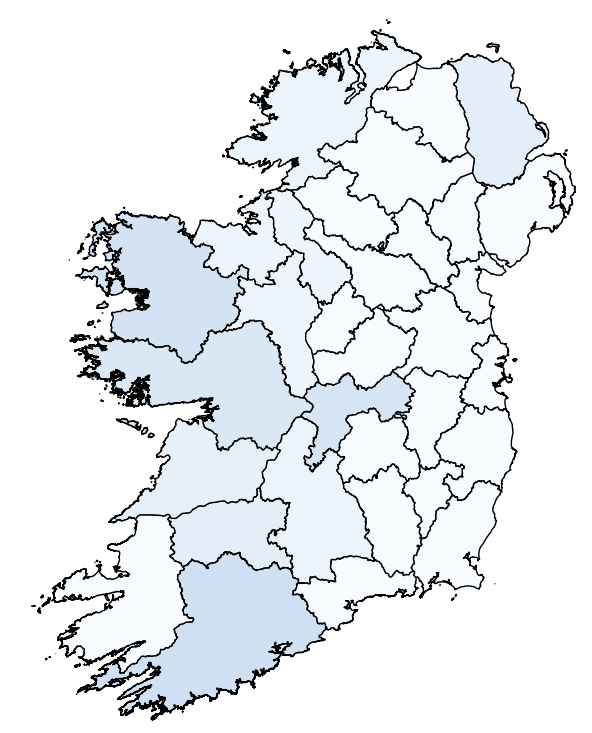
When I try to plot ireland_sales with the Volume column, I get this:
Happy days! However, when I try to consolidate my data to just one point per county using a groupby sum and then a merge, plotting ireland_sales_summed with the County Volume Total column gets me a nearly imperceptible line graph instead of a map:

My data for ireland_sales and ireland_sales_summed look like this:

My code is below. Thanks in advance for the help!
import pandas as pd
import geopandas as gpd
import matplotlib.pyplot as plt

#read shapefiles

ni = gpd.read_file(#shapefile_path)
republic = gpd.read_file(#shapefile_path)

#create NI centroids

ni['centroid'] = ni['geometry'].centroid

#convert NI centroids to x/y to match Republic shapefile

ni['centroid'] = ni['centroid'].astype(str)
ni['centroid'] = ni.apply(lambda x: x['centroid'][7:-1], axis=1)
ni[['CENTROID_X','CENTROID_Y']] = ni['centroid'].str.split(' ', expand=True)
ni = ni.drop(['centroid'], axis=1)

#bring shapefiles into common coordinate system

ni = ni.to_crs('EPSG:4326')
republic = republic.to_crs('EPSG:4326')

#merge shapefiles
ireland = gpd.pd.concat([republic, ni])
counties = []
for i in ireland['COUNTY']:
    if type(i) == str:
        counties.append(i)
for i in ireland['CountyName']:
    if type(i) == str:
        counties.append(i)
ireland['County'] = counties
ireland = ireland.drop(['COUNTY', 'CountyName','ENGLISH', 'GAEILGE', 'CONTAE', 'PROVINCE', 'OBJECTID'], axis=1)

#read in and process data

sales = pd.read_csv(#data_path)

ireland_sales = ireland.merge(sales, on='County')
ireland = ireland[~ireland['County'].isin(sales['County'])]
ireland_sales = pd.concat([ireland_sales, ireland])
ireland_sales['Volume'] = ireland_sales['Volume'].fillna(0)

ireland_vol_total = ireland_sales.groupby('County').sum(numeric_only=True)
ireland_vol_total = ireland_vol_total.drop(['AREA'], axis=1)
ireland_vol_total = ireland_vol_total.rename(columns={'Volume':'County Volume Total'})

ireland_sales_summed = ireland_vol_total.merge(ireland_sales, on='County')
ireland_sales_summed = ireland_sales_summed.drop(['Customer', 'Volume'], axis=1)
ireland_sales_summed = ireland_sales_summed.drop_duplicates(subset=['County'],keep='first')

#plot data

fig, ax = plt.subplots(1, 1)
fig.set_size_inches(10,10)
ireland_sales_summed.plot(ax=ax, column='County Volume Total', cmap='Blues')

ax.set_axis_off()

plt.show()