Hi folks!
I encountered some unexpected behavior in `Mesh3d`. I hope you coul…d have a look. It is hard for me to judge if these are issues, here or upstream, or I am missing something.
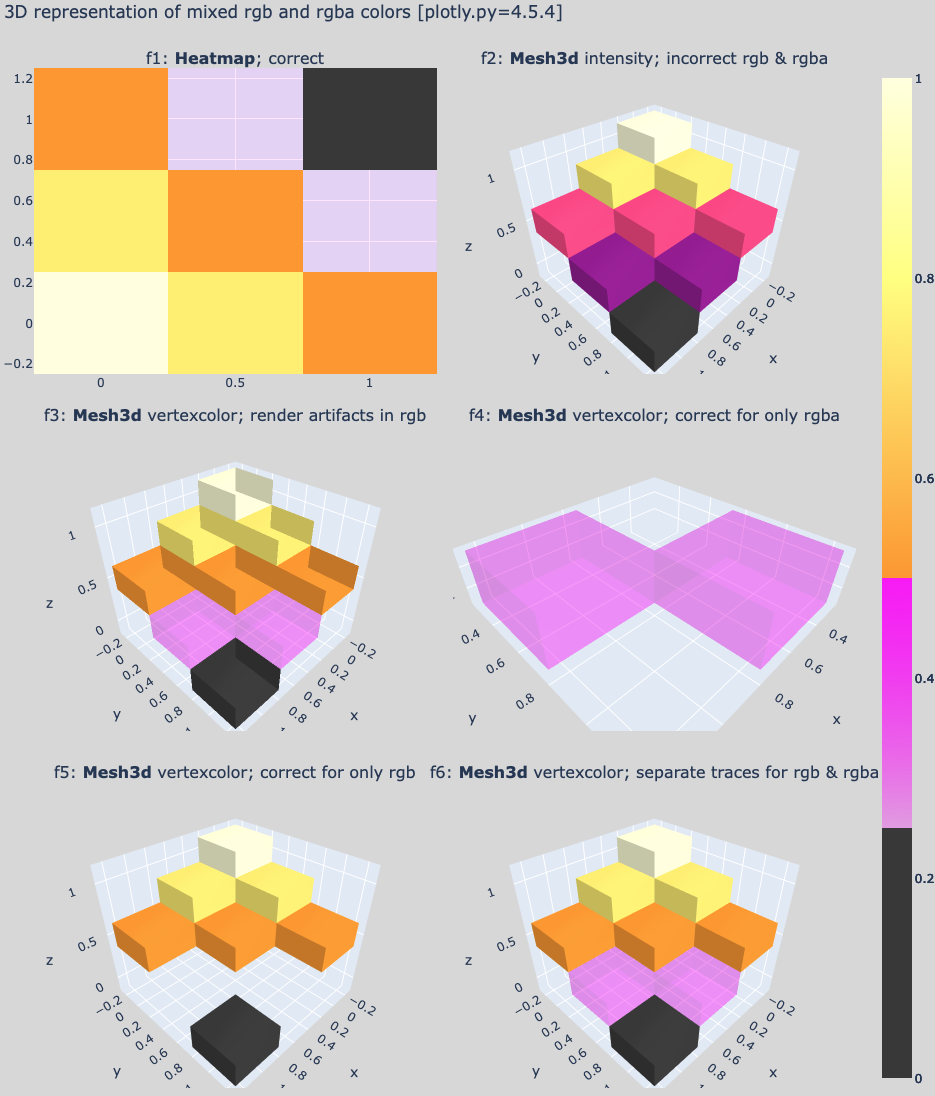
1. Incorrect colors in plots with `intensity` and a **discontinuous** `colorscale` (see panel f2).
a) Colors with opacity (rgba) are shown without opacity (rgb). This issue was reported before.
b) Discontinuous transitions in the `colorscale` appear to be ignored. As a result, colors are introduced that are not found in the colorscale. In the example, panel f2: purple = black + magenta, raspberry = magenta + orange.
c) I would expect the same colorscale behavior as in 'scatter' or 'heatmap' (panel f1).
2. Render artifacts occur for `facecolor` or `vertexcolor` surfaces, when rgb and rgba colors are put in the same trace (see panel f3).
a) Surfaces do look opaque when _only_ rgb colors are present (panel f5).
b) A partial workaround was to plot rgb and rgba vertices in separate traces (panel f6). Not sure what to do when vertices have a gradient between rgb and rgba...
3. An additional trace is needed to add a colorbar when `facecolor` or `vertexcolor` is used instead of `intensity`.
a) I do expect the colorbar to be dropped when colors are hardcoded. But the workaround to add a custom `colorbar` or `coloraxis` with a 'hidden' trace may not be obvious to everyone. Add an example to the documentation?
4. The rgba colors in the `colorbar` appear mixed with layout `paper_bgcolor`, effectively the transparent magenta colors are too dark in the Working Example.
a) Can a `colorbar` background be set to match the (default) plot background color?
5. The image above is a screenshot and differs from the exported image, using `f7.write_image(...)` after the Working Example below.
a) In my exported copy, some of the layout `scene` axes appeared 'ghost'-duplicated into the next subplot. Only visible if the scene axes (ranges) change between subplots. Issue on my system or in Orca?
Screenshot 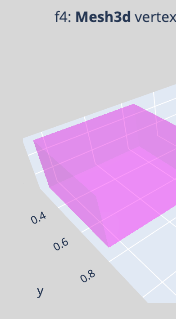 _vs_ Orca[1.3.0] 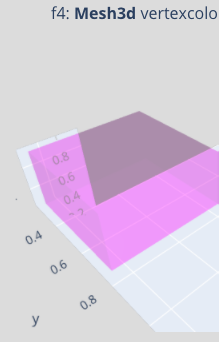
Finally, for a large number of shapes (or animations) I noticed significant performance loss in looking up and hardcoding the colors of vertices. Ideally, I would get the `intensity` method of `Mesh3d` to give me the expected result (more like f6, less like f2). Any ideas? **Your advise is appreciated!**
```python
import numpy as np
import itertools
import plotly as py
import plotly.graph_objects as go
from plotly.subplots import make_subplots
def flatten_dict(d):
return({k: [y for x in [v[k] for v in d] for y in x] for k in d[0]})
def reindex_voxels(dl):
m=0
res = []
for i,od in enumerate(dl):
ix = len(dl[i]['x'])
d = od.copy()
for n in ['i','j','k']:
d[n] = [ m + j for j in d[n] ]
m += ix
res.append(d)
return(flatten_dict(res))
# some data
x = y = np.linspace(0,1,3)
x,y = np.meshgrid(x,y)
z = 1-(x+y)/2
# custom colorscale, mixed rgb and rgba, discontinuous breaks
cs = [[0.0, 'rgb(64, 64, 64)'],
[0.25, 'rgb(64, 64, 64)'],
[0.25, 'rgba(255, 0, 255, 0.1)'],
[0.5, 'rgba(255, 0, 255, 0.5)'],
[0.5, 'rgb(255, 160, 33)'],
[0.8, 'rgb(255, 255, 129)'],
[1.0, 'rgb(255, 255, 225)']]
# list of shapes
vxl = \
[{'x': [-0.25, -0.25, 0.25, 0.25, -0.25, -0.25, 0.25, 0.25],
'y': [-0.25, 0.25, 0.25, -0.25, -0.25, 0.25, 0.25, -0.25],
'z': [0.875, 0.875, 0.875, 0.875, 1.125, 1.125, 1.125, 1.125],
'i': [7, 0, 0, 0, 4, 4, 2, 6, 4, 0, 3, 7],
'j': [3, 4, 1, 2, 5, 6, 5, 5, 0, 1, 2, 2],
'k': [0, 7, 2, 3, 6, 7, 1, 2, 5, 5, 7, 6],
'intensity': [1.0, 1.0, 1.0, 1.0, 1.0, 1.0, 1.0, 1.0]},
{'x': [0.25, 0.25, 0.75, 0.75, 0.25, 0.25, 0.75, 0.75],
'y': [-0.25, 0.25, 0.25, -0.25, -0.25, 0.25, 0.25, -0.25],
'z': [0.625, 0.625, 0.625, 0.625, 0.875, 0.875, 0.875, 0.875],
'i': [7, 0, 0, 0, 4, 4, 2, 6, 4, 0, 3, 7],
'j': [3, 4, 1, 2, 5, 6, 5, 5, 0, 1, 2, 2],
'k': [0, 7, 2, 3, 6, 7, 1, 2, 5, 5, 7, 6],
'intensity': [0.75, 0.75, 0.75, 0.75, 0.75, 0.75, 0.75, 0.75]},
{'x': [0.75, 0.75, 1.25, 1.25, 0.75, 0.75, 1.25, 1.25],
'y': [-0.25, 0.25, 0.25, -0.25, -0.25, 0.25, 0.25, -0.25],
'z': [0.375, 0.375, 0.375, 0.375, 0.625, 0.625, 0.625, 0.625],
'i': [7, 0, 0, 0, 4, 4, 2, 6, 4, 0, 3, 7],
'j': [3, 4, 1, 2, 5, 6, 5, 5, 0, 1, 2, 2],
'k': [0, 7, 2, 3, 6, 7, 1, 2, 5, 5, 7, 6],
'intensity': [0.5, 0.5, 0.5, 0.5, 0.5, 0.5, 0.5, 0.5]},
{'x': [-0.25, -0.25, 0.25, 0.25, -0.25, -0.25, 0.25, 0.25],
'y': [0.25, 0.75, 0.75, 0.25, 0.25, 0.75, 0.75, 0.25],
'z': [0.625, 0.625, 0.625, 0.625, 0.875, 0.875, 0.875, 0.875],
'i': [7, 0, 0, 0, 4, 4, 2, 6, 4, 0, 3, 7],
'j': [3, 4, 1, 2, 5, 6, 5, 5, 0, 1, 2, 2],
'k': [0, 7, 2, 3, 6, 7, 1, 2, 5, 5, 7, 6],
'intensity': [0.75, 0.75, 0.75, 0.75, 0.75, 0.75, 0.75, 0.75]},
{'x': [0.25, 0.25, 0.75, 0.75, 0.25, 0.25, 0.75, 0.75],
'y': [0.25, 0.75, 0.75, 0.25, 0.25, 0.75, 0.75, 0.25],
'z': [0.375, 0.375, 0.375, 0.375, 0.625, 0.625, 0.625, 0.625],
'i': [7, 0, 0, 0, 4, 4, 2, 6, 4, 0, 3, 7],
'j': [3, 4, 1, 2, 5, 6, 5, 5, 0, 1, 2, 2],
'k': [0, 7, 2, 3, 6, 7, 1, 2, 5, 5, 7, 6],
'intensity': [0.5, 0.5, 0.5, 0.5, 0.5, 0.5, 0.5, 0.5]},
{'x': [0.75, 0.75, 1.25, 1.25, 0.75, 0.75, 1.25, 1.25],
'y': [0.25, 0.75, 0.75, 0.25, 0.25, 0.75, 0.75, 0.25],
'z': [0.125, 0.125, 0.125, 0.125, 0.375, 0.375, 0.375, 0.375],
'i': [7, 0, 0, 0, 4, 4, 2, 6, 4, 0, 3, 7],
'j': [3, 4, 1, 2, 5, 6, 5, 5, 0, 1, 2, 2],
'k': [0, 7, 2, 3, 6, 7, 1, 2, 5, 5, 7, 6],
'intensity': [0.25, 0.25, 0.25, 0.25, 0.25, 0.25, 0.25, 0.25]},
{'x': [-0.25, -0.25, 0.25, 0.25, -0.25, -0.25, 0.25, 0.25],
'y': [0.75, 1.25, 1.25, 0.75, 0.75, 1.25, 1.25, 0.75],
'z': [0.375, 0.375, 0.375, 0.375, 0.625, 0.625, 0.625, 0.625],
'i': [7, 0, 0, 0, 4, 4, 2, 6, 4, 0, 3, 7],
'j': [3, 4, 1, 2, 5, 6, 5, 5, 0, 1, 2, 2],
'k': [0, 7, 2, 3, 6, 7, 1, 2, 5, 5, 7, 6],
'intensity': [0.5, 0.5, 0.5, 0.5, 0.5, 0.5, 0.5, 0.5]},
{'x': [0.25, 0.25, 0.75, 0.75, 0.25, 0.25, 0.75, 0.75],
'y': [0.75, 1.25, 1.25, 0.75, 0.75, 1.25, 1.25, 0.75],
'z': [0.125, 0.125, 0.125, 0.125, 0.375, 0.375, 0.375, 0.375],
'i': [7, 0, 0, 0, 4, 4, 2, 6, 4, 0, 3, 7],
'j': [3, 4, 1, 2, 5, 6, 5, 5, 0, 1, 2, 2],
'k': [0, 7, 2, 3, 6, 7, 1, 2, 5, 5, 7, 6],
'intensity': [0.25, 0.25, 0.25, 0.25, 0.25, 0.25, 0.25, 0.25]},
{'x': [0.75, 0.75, 1.25, 1.25, 0.75, 0.75, 1.25, 1.25],
'y': [0.75, 1.25, 1.25, 0.75, 0.75, 1.25, 1.25, 0.75],
'z': [-0.125, -0.125, -0.125, -0.125, 0.125, 0.125, 0.125, 0.125],
'i': [7, 0, 0, 0, 4, 4, 2, 6, 4, 0, 3, 7],
'j': [3, 4, 1, 2, 5, 6, 5, 5, 0, 1, 2, 2],
'k': [0, 7, 2, 3, 6, 7, 1, 2, 5, 5, 7, 6],
'intensity': [0.0, 0.0, 0.0, 0.0, 0.0, 0.0, 0.0, 0.0]}]
# shape colors
cid = ['rgb(255, 255, 220)','rgb(255, 239, 113)',
'rgb(255, 160, 33)','rgb(255, 239, 113)',
'rgb(255, 160, 33)','rgba(255, 0, 255, 0.2)',
'rgb(255, 160, 33)','rgba(255, 0, 255, 0.2)',
'rgb(64, 64, 64)']
# concatenate shapes
vxa = reindex_voxels(vxl)
# concatenate and replace 'intensity' with 'vertexcolor'
vxb = reindex_voxels([{**{i:j for i,j in v.items() if i in ['x','y','z','i','j','k']},
**{'vertexcolor': [k]*len(v['x'])}} for k,v in zip(cid,vxl)])
# split vertices with opacity (rgba) and without opacity (rgb) , and replace 'intensity' by 'vertexcolor'
vxc0 = reindex_voxels([{**{i:j for i,j in v.items() if i in ['x','y','z','i','j','k']},
**{'vertexcolor': [k]*len(v['x'])}} for k,v in zip(cid,vxl) if k.startswith('rgba(')])
vxc1 = reindex_voxels([{**{i:j for i,j in v.items() if i in ['x','y','z','i','j','k']},
**{'vertexcolor': [k]*len(v['x'])}} for k,v in zip(cid,vxl) if k.startswith('rgb(')])
# figures
f1 = go.Figure(data=[go.Heatmap(x=x.ravel(),y=y.ravel(),z=z.ravel(),colorscale=cs)])
f2 = go.Figure(data=[go.Mesh3d(**vxa,colorscale=cs)])
f3 = go.Figure(data=[go.Mesh3d(**vxb,colorscale=cs)])
f4 = go.Figure(data=[go.Mesh3d(**vxc0)])
f5 = go.Figure(data=[go.Mesh3d(**vxc1)])
# multiple traces; 'vertexcolor' for rgb and rgba _and_ a transparent trace with 'intensity' to add a 'colorscale'
f6 = go.Figure(data=[go.Mesh3d(**vxc0),
go.Mesh3d(**vxc1),
go.Mesh3d(**vxa,opacity=0,colorscale=cs)])
#f6.show()
# merge figures
ncol=2
nrow=3
fig = make_subplots(cols=ncol,rows=nrow,vertical_spacing=0.05,horizontal_spacing=0.02,
specs= ( np.array([{'type':'heatmap'},{'type':'scatter3d'}]+[{'type':'scatter3d'}]*4)
.reshape(nrow,ncol).tolist() ),
subplot_titles=['f1: <b>Heatmap</b>; correct',
'f2: <b>Mesh3d</b> intensity; incorrect rgb & rgba',
'f3: <b>Mesh3d</b> vertexcolor; render artifacts in rgb',
'f4: <b>Mesh3d</b> vertexcolor; correct for only rgba',
'f5: <b>Mesh3d</b> vertexcolor; correct for only rgb',
'f6: <b>Mesh3d</b> vertexcolor; separate traces for rgb & rgba'])
fig.update_layout(height=1200,width=1000,title_text='3D representation of mixed rgb and rgba colors [plotly.py={}]'.format(py.__version__))
f7 = go.Figure(fig)
for loc,f in zip(list(itertools.product(*[range(1,nrow+1),range(1,ncol+1)])),[f1,f2,f3,f4,f5,f6]):
if f is not None:
for d in f['data']:
f7.add_trace(d,row=loc[0],col=loc[1])
f7.show()
```
Sorry, not a very short MWE...


