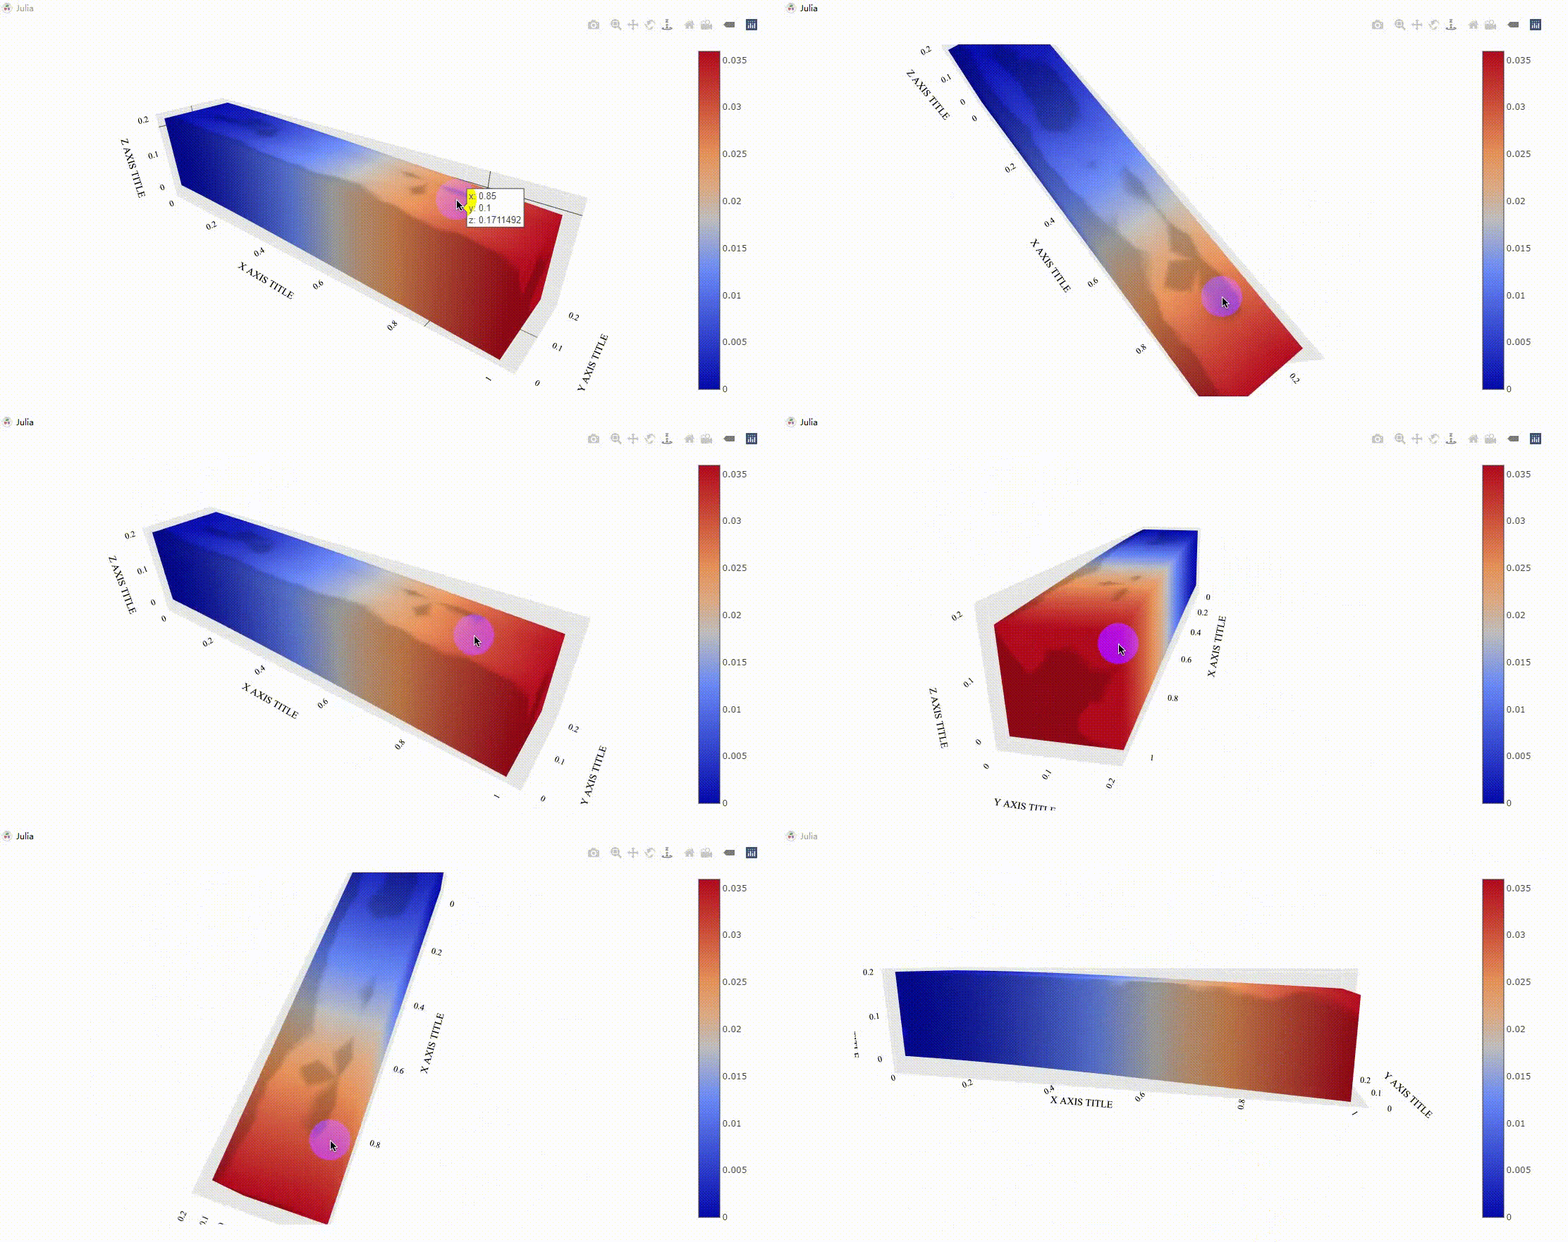
I’m using PlotlyJS.jl to draw my model and I chose to use mesh3d() for my task in Julia language. The model is composed of tetrahedral elements, so i_1 , j_1 , k_1 represent the serial number of one of the triangular faces. The code reads as follows:
using PlotlyJS

trace = mesh3d(x = [...],
               y = [...],
               z = [...],
               i = [i_1, i_2, ...],
               j = [j_1, i_2, ...],
               k = [k_1, k_2, ...])

layout = Layout(...)

plot(trace, layout)
I’m not sure if there’s a problem with the red area being displayed in the picture. After that, I added something about intensity:
using PlotlyJS

trace = mesh3d(x = [...],
               y = [...],
               z = [...],
               i = [i_1, i_2, ...],
               j = [j_1, i_2, ...],
               k = [k_1, k_2, ...],
               intensity = abs.(result[:,3]),
               intensitymode = "vertex",
               colorscale = "RdBu")

layout = Layout(...)

plot(trace, layout)
The same problem can be seen in the red area. It may change with perspective:
But I think maybe it should be like the picture below:

Is there anything I can do? I’m not sure what’s wrong. 


