I wonder if there are any modules/plugins/examples for Dash to view CAD files like OBJ, DXF or SKP? I am also interested in visualizing data on the Cad/3D files.
/Max
There isn’t a native CAD viewer in Dash yet, but here are some other options:
- In the community, @empet made a really amazing
.plytomesh3dscript, here’s an example: https://plot.ly/~empet/14749 - In the React community, looks like autodesk has opensourced some work to render models in the browser: https://github.com/Autodesk-Forge/viewer-react-express-headless. If there is a standalone JS library available, then it could be wrapped as a custom Dash component: https://github.com/plotly/dash-component-boilerplate
Just curious, what’s your particular use case for using Dash to do this?
Thanks a lot. I am involved in a project where we want to visualize 3D Rhino grasshopper simulations (daylight, energy performance and thermal comfort) combined with CAD geometries to optimize buildings and whole areas. The plan is develop a platform for architects and engineers to exchange information and I think Dash would be very useful.
@maxt A mesh3d can be derived from an obj file, too: https://plot.ly/~empet/15040
Data from a DXF file can be extracted via the Python package dxfgrabber
https://dxfgrabber.readthedocs.io/en/latest/
and then use them to define plotly traces
representing the corresponding DXF drawings.


Hi Max!
Did you get the answer to your question here?
Small world : )
I thought your page on listing building energy optimization tools at
may be of ineterst to @alexcjohnson @jack
Updates of the notebooks illustrating how to extract data for a Mesh3d instance from files in ply, off, Wavefront obj or STL format:
-
https://plot.ly/~empet/14749 for
ply,offorobjwithout vertex colors -
https://plot.ly/~empet/15040
objwith color code for each vertex -
https://plot.ly/~empet/15276
STL
Hi @empet, thanks for the useful answer.
Regarding STL files, some exporters include color data in the attributes (see Wiki). Here some code example, based on yours that takes advantage of this feature. It is not optimized but just to show what is possible.
BR, Alex-
from stl import mesh
import numpy as np
import plotly.graph_objects as go

def get_stl_color(x):
    #two "attribute byte count" bytes at the end of every triangle to store a 15-bit RGB color
    #bits 0 to 4 are the intensity level for blue (0 to 31)
    #bits 5 to 9 are the intensity level for green (0 to 31)
    #bits 10 to 14 are the intensity level for red (0 to 31)
    sb = f'{x:015b}'[::-1]
    r = str(int(255/31*int(sb[:5],base=2)))
    g = str(int(255/31*int(sb[5:10],base=2)))
    b = str(int(255/31*int(sb[10:15],base=2)))
    color = f'rgb({r},{g},{b})'
    return color

def stl2mesh3d(stl_file):
    stl_mesh = mesh.Mesh.from_file(stl_file)
    # stl_mesh is read by nympy-stl from a stl file; it is  an array of faces/triangles (i.e. three 3d points)
    # this function extracts the unique vertices and the lists I, J, K to define a Plotly mesh3d
    p, q, r = stl_mesh.vectors.shape #(p, 3, 3)
    # the array stl_mesh.vectors.reshape(p*q, r) can contain multiple copies of the same vertex;
    # extract unique vertices from all mesh triangles
    vertices, ixr = np.unique(stl_mesh.vectors.reshape(p*q, r), return_inverse=True, axis=0)
    I = np.take(ixr, [3*k for k in range(p)])
    J = np.take(ixr, [3*k+1 for k in range(p)])
    K = np.take(ixr, [3*k+2 for k in range(p)])
    facecolor = np.vectorize(get_stl_color)(stl_mesh.attr.flatten())
    x,y,z = vertices.T
    trace = go.Mesh3d(x=x, y=y, z=z, i=I, j=J, k=K, facecolor=facecolor)
    # optional parameters to make it look nicer
    trace.update(flatshading=True, lighting_facenormalsepsilon=0, lighting_ambient=0.7)
    return trace
Here an example of how it looks:

Hey all, thanks for putting this material available.
I’m facing a challenge to get data from a DXF file and plot it using traces as @empet suggested. I’m using ezdxf to get the entities (CIRCLE, LINES, ARC, LWPOLYLINE, etc…) from the file as well as the points related to each one. Here is an example for the lines:
import ezdxf
import numpy as np
import plotly.graph_objects as go
import plotly.offline as pyo


doc = ezdxf.readfile("8770PZ-M-00003.dxf")

msp = doc.modelspace()

lines = msp.query('LINE')

len(lines)

data = []

for line in lines:
    x,y,z = np.linspace(line.dxf.start,line.dxf.end).T

    data.append(
        go.Scatter3d(
        x=x,
        y=y,
        z=z,
        line=dict(
            color='darkblue',
            width=1
        )
        ))


fig = go.Figure(data=data)

fig.update_layout()

pyo.plot(fig,filename='test.html')
The problem is rendering the image, in this case there are 10418 lines, which seem to be too many lines for plotting it. Am I missing something here? Should I just go over every entity and append to the data list as a specific trace to that entity?
Hi,
What a great thing with STL and colors!
I know it is old topic, but maybe others find their way to here.
I use Catia for CAD.
To export to STL with colors I use Keyshot Export formats - KeyShot Manual
Then using yours and Empet script.
import numpy as np
from stl import mesh
import plotly.graph_objects as go
from plotly.offline import download_plotlyjs, init_notebook_mode,  plot


def get_stl_color(x):
    #two "attribute byte count" bytes at the end of every triangle to store a 15-bit RGB color
    #bits 0 to 4 are the intensity level for blue (0 to 31)
    #bits 5 to 9 are the intensity level for green (0 to 31)
    #bits 10 to 14 are the intensity level for red (0 to 31)
    sb = f'{x:015b}'[::-1]
    r = str(int(255/31*int(sb[:5],base=2)))
    g = str(int(255/31*int(sb[5:10],base=2)))
    b = str(int(255/31*int(sb[10:15],base=2)))
    color = f'rgb({r},{g},{b})'
    return color


def stl2mesh3d(stl_file):
    stl_mesh = mesh.Mesh.from_file(stl_file)
    # stl_mesh is read by nympy-stl from a stl file; it is  an array of faces/triangles (i.e. three 3d points)
    # this function extracts the unique vertices and the lists I, J, K to define a Plotly mesh3d
    p, q, r = stl_mesh.vectors.shape #(p, 3, 3)
    # the array stl_mesh.vectors.reshape(p*q, r) can contain multiple copies of the same vertex;
    # extract unique vertices from all mesh triangles
    vertices, ixr = np.unique(stl_mesh.vectors.reshape(p*q, r), return_inverse=True, axis=0)
    I = np.take(ixr, [3*k for k in range(p)])
    J = np.take(ixr, [3*k+1 for k in range(p)])
    K = np.take(ixr, [3*k+2 for k in range(p)])
    facecolor = np.vectorize(get_stl_color)(stl_mesh.attr.flatten())
    x,y,z = vertices.T
    trace = go.Mesh3d(x=x, y=y, z=z, i=I, j=J, k=K, facecolor=facecolor)
    # optional parameters to make it look nicer
    trace.update(flatshading=True)
    return trace


filename = 'CEOPS.stl'

trace = stl2mesh3d(filename)


layout = go.Layout(paper_bgcolor='rgb(220,220,220)',
            title_text='Pump house', title_x=0.5,
                    font_color='black',
            width=800,
            height=800,
            scene_camera=dict(eye=dict(x=1.25, y=-1.25, z=1)),
            scene_xaxis_visible=False,
            scene_yaxis_visible=False,
            scene_zaxis_visible=False)

fig = go.Figure(go.Mesh3d(trace),  layout=layout)

fig.data[0].update(lighting=dict(ambient= 0.18,
                                  diffuse= 1,
                                  fresnel=  .1,
                                  specular= 1,
                                  roughness= .1,
                                  facenormalsepsilon=0))
fig.data[0].update(lightposition=dict(x=3000,
                                      y=3000,
                                      z=10000));

plot(fig)
Awesome @jharm ! Do you have a screenshot of what this looks like?
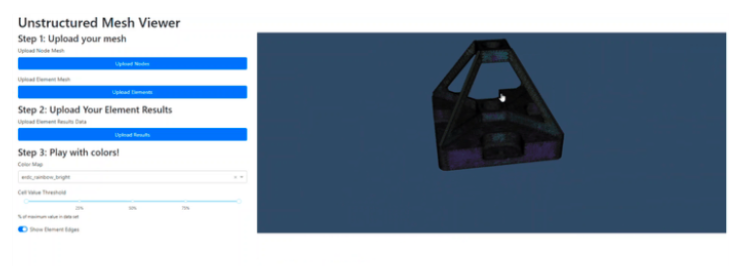
Some news on this front - We have dash-vtk which is an interface to the venerable VTK library, a very powerful and high performance mesh visualization library.
@skiefer wrote a great blog post explaining how they integrated dash-vtk with Ansys: Dash-vtk for visualizing unstructured mesh grids and integrating with Ansys
Of course I can share a picture.

There are still some issues with translating colors from keyshot. I have changed the get_stl_color so it reads a little bit different. It is better but still not correct. This must be after the vacation! Have a great summer 
def get_stl_color(x):
    #two "attribute byte count" bytes at the end of every triangle to store a 15-bit RGB color
    #bits 1 to 5 are the intensity level for red (0 to 31)
    #bits 6 to 11 are the intensity level for green (0 to 31)
    #bits 12 to 16 are the intensity level for blue (0 to 31)

    sb = f'{x:015b}'[1:]
    r = str(int(255/31*int(sb[:5],base=2)))
    g = str(int(255/31*int(sb[5:10],base=2)))
    b = str(int(255/31*int(sb[10:15],base=2)))
    color = f'rgb({r},{g},{b})'
    return color
Hey Maxt, I am also looking into doing something very similar. Curious to hear if you managed to get this done?