Dear DASH - Plotly community
I have pretty much finished my 3D sketch. One wish remains - in classical CAD software you can rotate the image, but you can always return to an isometric view (in DASH I can choose HOME and CAMERA views) but you can also always select top, side or front view. As an example with FreeCAD ( Manual:Navigating in the 3D view - FreeCAD Documentation) This is what it looks like:

Here is what my code looks now:
"""
sample3d.py code snippet shows how to use Mesh3d with DASH
"""
from dash import Dash, dcc, html
import plotly.graph_objects as go
import numpy as np

# ---------- BEGIN INPUT PARAMETERS ----------

dd = 11.5       # Driver Diameter, in [cm]
vb = 8*1e-3     # box volume 8 liter, in [m^3]
lxlz = 0.8      # Lx/Lz
lylz = 1.25     # Ly/Lz
ydrv = 0.6      # Yd/Ly
yprt = 0.2      # Yp/Ly
Lz = 100*(vb/lxlz/lylz)**(1/3)  # depth, 20 [cm]
Lx = lxlz*Lz    # width, 16 [cm]
Ly = lylz*Lz    # height, 25 [cm]
Yp = yprt*Ly
Yd = ydrv*Ly
lp = 13.7       # length of port, 13.7 [cm]
dp = 1.25*2.54  # diameter of port, 1.25 inches = 3.2 [cm]

# ---------- END INPUT PARAMETERS ----------

colorscale = [[0, 'blue'],
             [1, 'blue']]

r2 = dd/2           # radius of cylinder (from mm to cm)
a2 = -dd/20         # (make it shallow), half into the box, half out of the box
h2 = dd/10          # length of cylinder (driver)

r1 = dp/2           # radius of cylinder
a1 = -lp-a2         # a bit sticks out of the box (same as for the driver)
h1 = lp             # length of cylinder (port)

# Code example : https://community.plotly.com/t/basic-3d-cylinders/27990
def cylinder(r, h, a=0, Y=0, nt=100, nv=50):
    """
    parametrize the cylinder of radius r, height h, base point a
    """
    theta = np.linspace(0, 2*np.pi, nt)
    v = np.linspace(a, a+h, nv )
    theta, v = np.meshgrid(theta, v)
    x = r*np.cos(theta)
    y = r*np.sin(theta)+Y
    z = v
    return x, y, z

def boundary_circle(r, h, Y=0, nt=100):
    """
    r - boundary circle radius
    h - height above xOy-plane where the circle is included
    returns the circle parameterization
    """
    theta = np.linspace(0, 2*np.pi, nt)
    x = r*np.cos(theta)
    y = r*np.sin(theta)+Y
    z = h*np.ones(theta.shape)
    return x, y, z

def circle(x, y, z, r):
    """
    Create a circular mesh located at x, y, z with radius r
    """
    r_discr = np.linspace(0, r, 2)
    theta_discr = np.linspace(0, 2*np.pi, 36)
    r_grid, theta_grid = np.meshgrid(r_discr, theta_discr)
    x_circle = r_grid * np.cos(theta_grid) + x
    y_circle = r_grid * np.sin(theta_grid) + y
    z_circle = np.zeros_like(x_circle) + z
    return x_circle, y_circle, z_circle

x1, y1, z1 = cylinder(r1, h1, Y=Yp, a=a1)   # port

cyl1 = go.Surface(x=x1, y=y1, z=z1,
                 colorscale = colorscale,
                 showscale=False,
                 opacity=0.5)

xb_low, yb_low, zb_low = boundary_circle(r1, h=a1, Y=Yp)
xb_up, yb_up, zb_up = boundary_circle(r1, h=a1+h1, Y=Yp)

bcircles1 = go.Scatter3d(x = xb_low.tolist()+[None]+xb_up.tolist(),
                        y = yb_low.tolist()+[None]+yb_up.tolist(),
                        z = zb_low.tolist()+[None]+zb_up.tolist(),
                        mode ='lines',
                        line = dict(color='blue', width=2),
                        opacity =0.75, showlegend=False)

x2, y2, z2 = cylinder(r2, h2, Y=Yd, a=a2)  # driver, a flat disk

cyl2 = go.Surface(x=x2, y=y2, z=z2,
                 colorscale = colorscale,
                 showscale=False,
                 opacity=0.5)

xb_low, yb_low, zb_low = boundary_circle(r2, h=a2, Y=Yd)
xb_up, yb_up, zb_up = boundary_circle(r2, h=a2+h2, Y=Yd)

bcircles2 = go.Scatter3d(x = xb_low.tolist()+[None]+xb_up.tolist(),
                        y = yb_low.tolist()+[None]+yb_up.tolist(),
                        z = zb_low.tolist()+[None]+zb_up.tolist(),
                        mode ='lines',
                        line = dict(color='blue', width=2),
                        opacity =0.75, showlegend=False)

x_circle2, y_circle2, z_circle2 = circle(0, Yd, 0, r2)
endcap2 = go.Surface(x=x_circle2, y=y_circle2, z=z_circle2,
                     colorscale = colorscale,
                     showscale=False,
                     opacity=0.5)

box1 = go.Mesh3d(
        x = [-0.5*Lx, -0.5*Lx, 0.5*Lx, 0.5*Lx, -0.5*Lx, -0.5*Lx, 0.5*Lx, 0.5*Lx],
        y = [0, Ly, Ly, 0, 0, Ly, Ly, 0],
        z = [0, 0, 0, 0, -Lz, -Lz, -Lz, -Lz],
        opacity=0.6,
        color='#CCCCCC',        # light grey
        # i, j and k give the vertices of triangles for the box (cube)
        i = [7, 0, 0, 0, 4, 4, 6, 6, 4, 0, 3, 2],
        j = [3, 4, 1, 2, 5, 6, 5, 2, 0, 1, 6, 3],
        k = [0, 7, 2, 3, 6, 7, 1, 1, 5, 5, 7, 6],
        # without i,j,k the faces of the box are not visible
        flatshading=True
    )

#layout = go.Layout(scene_xaxis_visible=False, scene_yaxis_visible=False, scene_zaxis_visible=False)
#fig =  go.Figure(data=[box1, cyl1, bcircles1, cyl2, bcircles2, endcap2], layout=layout)
fig =  go.Figure(data=[box1, cyl1, bcircles1, cyl2, bcircles2, endcap2])

# Draw a smaller box in a larger coordinate system (make room for zoom), show axis text
fig.update_layout(scene=dict(
                      xaxis=dict(title='X Axis', range=[-0.75*Lx, 0.75*Lx]),
                      yaxis=dict(title='Y Axis', range=[-0.25*Ly, 1.25*Ly]),
                      zaxis=dict(title='Z Axis', range=[-1.25*Lz, 0.25*Lz])
                      )
                 )

camera = dict(                      # https://plotly.com/python/3d-camera-controls/
    up=dict(x=0, y=1, z=0),         # default z=1, we want y-axis to be up
    center=dict(x=0, y=0, z=0),     # default 0,0,0 (Origin)
    eye=dict(x=0.5, y=0.25, z=1.5)  # default 1.25 in all directions
)

fig.update_layout(scene_camera=camera,
                  yaxis = dict(scaleanchor = 'x'))  # keep x,y aspect ratio

fig.layout.scene.camera.projection.type = "orthographic"    # default "perspective"

app = Dash()
app.layout = html.Div([
    dcc.Graph(id='sketch',
              style={'height':'600px','width':'900p'},
              figure=fig)
])

app.run_server(debug=True)
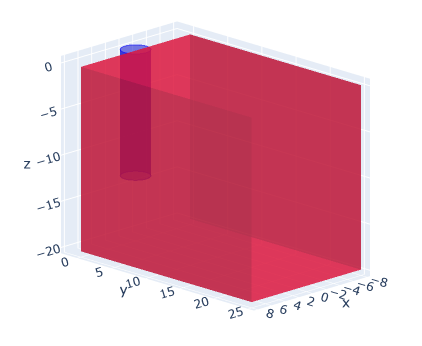
This is the output:
In the upper right corner you see the icons for zoom, etc. and the HOME button as well as the CAMERA view button.
Adding FRONT view, SIDE view and TOP view would help users who are not familiar with rotating items using their computer mouse (people who are not fluent in CAD software). FreeCAD even has a Navigation Cube…
With kind regards,
Claus