Hello all,
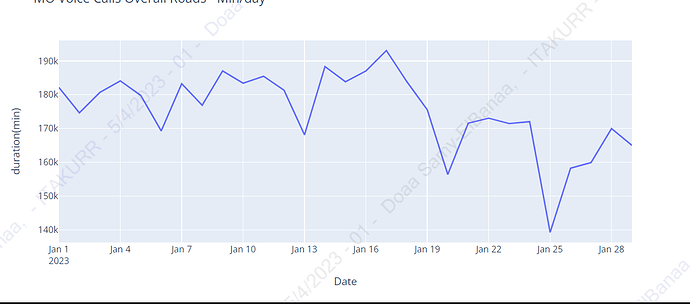
I have a page contains many graph and I put a datepicker range for one of them, to filter my graph which is contain a line chart to represent the usage minutes over period of time as shown below
this is the initial graph for my page
I need to update this graph based on the user input for start date and end date
The below screen contain my graph component
and this is the code of callback which I need to apply on my graph to update the range of time period
@app.callback(
    Output('mo-overall-paragraph', 'figure'),
    [Input('my-date-picker-range', 'start_date'),
     Input('my-date-picker-range', 'end_date')],
)
def update_output(start_date, end_date):
    print(start_date, end_date)
    print(mo_voice_traffic_org_overall.head(50))
    dff = mo_voice_traffic_org_overall.set_index('Date').loc[start_date:end_date, :]
    dff = dff.reset_index()
    print(dff)
    if not start_date or not end_date:
        raise dash.exceptions.PreventUpdate
    else:
        return px.line(data_frame=dff,  markers=False).update_layout()
and when I run my app I have this error
So, any one can help me how I do this ( update the initial graph which have all time period, to the range of time select by user)
Thanks in advance.
1 Like
You are looking for the figure layout range property
Something like
@app.callback(
Output(‘mo-overall-paragraph’, ‘figure’),
Input(‘my-date-picker-range’, ‘start_date’),
Input(‘my-date-picker-range’, ‘end_date’),
)

def update_output(start_date, end_date):

   if not start_date or not end_date:
       raise dash.exceptions.PreventUpdate
   else:
       mo-overall-paragraph = Patch()
       mo-overall-paragraph['layout']['xaxis']['range'][0] = start_date
       mo-overall-paragraph['layout']['xaxis']['range'][1] = end_date
       return mo-overall-paragraph
Thanks for your response but I have this error
TypeError: ‘Table’ object is not callable
Here a screen of my code did I do this in a right way?
yes, I’m sorry according to the Patch() doc limitations it seems you may need to add the state to your call back. if you did not previously stored theses values in a dcc component you can try using the fig state.
@app.callback(
Output(‘mo-overall-paragraph’, ‘figure’),
Input(‘my-date-picker-range’, ‘start_date’),
Input(‘my-date-picker-range’, ‘end_date’),
State(‘mo-overall-paragraph’, ‘figure’),
)

def update_output(start_date, end_date, mo-overall-paragraph):

   if not start_date or not end_date:
       raise dash.exceptions.PreventUpdate
   else:
       mo-overall-paragraph = Patch()
       mo-overall-paragraph['layout']['xaxis']['range'][0] = start_date
       mo-overall-paragraph['layout']['xaxis']['range'][1] = end_date
       return mo-overall-paragraph
I have not read much into the new patch() but either way you should be looking for the layout x axis range 0 and 1
I needed to upgrade my dash version to 2.9.3 to import the right Patch package
But I have this error after it
and this the sample of code that raised this error
Could you try to update your callback as below?
@app.callback(
    Output('mo-overall-paragraph', 'figure'),
    [Input('my-date-picker-range', 'start_date'),
     Input('my-date-picker-range', 'end_date')],
)
def update_output(start_date, end_date):
    dff = mo_voice_traffic_org_overall[(mo_voice_traffic_org_overall['Date'] >= start_date) & (mo_voice_traffic_org_overall['Date'] <= end_date)]
    if not start_date or not end_date:
        raise dash.exceptions.PreventUpdate
    else:
        fig = px.line(data_frame=dff,  x='Date', y='duration(min)', markers=False).update_layout()
        return fig
Thanks for your help, the code work for me now
but when I applied it on graph have multiple lines doesn’t work and I can’t understand the reason
if it works for one line or I miss something?


