I am trying to write this matplot function and plot a graph using plotly instead of matplot but i am unable to do so. Here is the function for the plot:
def plot_one_signal_sequentially(
    mres_all,
    y_sort,
    case_no,
    avg_window_size=10,
    dpi=150,
    opacity_color=0.10,
    opacity_grid=0.10,
    m_avg=True,
    caption="MRE",
    y_label="MRE",
    legend_label="MRE",
    save_name="save.png",
):
    """
    Plot a trend of a signal.
    """

    # plot parameters
    colors = ["#33a02c", "#fdbf6f", "#e31a1c"]  # green, orange, red
    failed_reg = ["Healthy", "Degraded", "Failed"]
    pad_size = 0
    x_min = -pad_size

    # create pallette for color of trend lines
    pal = px.colors.sequential.Cubehelix(6, rot=-0.25, gamma=0.7)

    tool_class_change_index = np.where(y_sort[:-1] != y_sort[1:])[0]

    tool_class_change_index = tool_class_change_index - avg_window_size
    tool_class_change_index = np.concatenate(
        ([0], tool_class_change_index, [np.shape(y_sort)[0] - avg_window_size + 1])
    )

    indexer = (
        np.arange(2)[None, :]
        + np.arange(np.shape(tool_class_change_index)[0] - 1)[:, None]
    )

    # establish shaded region
    shade_reg = tool_class_change_index[indexer]

    x_max = len(y_sort) - avg_window_size + pad_size

    # define colour palette and seaborn style for plot
    sns.set(style="white", context="notebook")

    fig, axes = plt.subplots(
        1, 1, dpi=150, figsize=(7, 2.5), sharex=True, constrained_layout=True,
    )

    x = moving_average(mres_all, n=1)
    x2 = moving_average(mres_all, n=avg_window_size)
    y_avg = np.array([i for i in range(len(x2))]) + avg_window_size
    axes.plot(y_avg, x2, linewidth=1.5, alpha=1, color=pal[5], label="Rolling average")
    axes.plot(x, linewidth=0.5, alpha=0.5, color="grey", label=legend_label)
    y_min = np.min(x)
    y_max = np.max(x)
    y_pad = (np.abs(y_min) + np.abs(y_max)) * 0.02

    axes.spines["top"].set_visible(False)
    axes.spines["right"].set_visible(False)
    axes.spines["left"].set_visible(False)
    axes.spines["bottom"].set_visible(True)
    axes.grid(alpha=opacity_grid, linewidth=0.5)
    axes.tick_params(axis="x", labelsize=7.5)
    axes.tick_params(axis="y", labelsize=7.5)
    axes.spines["bottom"].set_linewidth(0.5)

    # colors
    axes.set_ylim(y_min - y_pad, y_max + y_pad)
    axes.set_xlim(x_min, x_max)
    axes.tick_params(axis="y", labelsize=7.5)
    axes.spines["bottom"].set_linewidth(0.5)
    for region in range(len(shade_reg)):

        f = failed_reg[region % 3]
        c = colors[region % 3]
        axes.fill_between(
            x=shade_reg[region],
            y1=y_min - y_pad,
            y2=y_max + y_pad,
            color=c,
            alpha=opacity_color,
            linewidth=0,
            zorder=1,
        )

        # for text
        axes.text(
            x=(
                shade_reg[region][0] + (shade_reg[region][1] - shade_reg[region][0]) / 2
            ),
            y=y_max + y_pad - y_max * 0.1,
            s=f,
            horizontalalignment="center",
            verticalalignment="center",
            size=8.5,
            color=c,
            rotation="horizontal",
            weight="semibold",
            alpha=1,
        )

    # axis label
    axes.set_xlabel("Sample Number", fontsize=7.5)
    axes.set_ylabel(y_label, fontsize=7.5)

    fig.suptitle(caption, fontsize=8.5)
    plt.legend(

        loc="center left", bbox_to_anchor=(0.02, 0.6), fontsize=7.5,
    )
    plt.show()
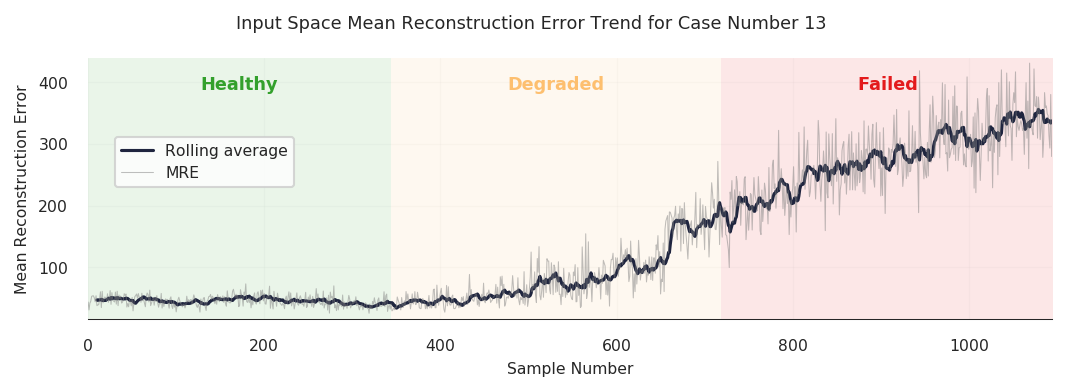
case = 13

caption = "Input Space Mean Reconstruction Error Trend for Case Number {} ".format(case)
legend_label = "MRE"

X_sort, y_sort = sorted_x(X, dfy, case)

mre_all, mre_avg = build_mre_scores(beta_vae_model, X_sort)

plot_one_signal_sequentially(
    mre_avg,
    y_sort,
    case,
    avg_window_size=10,
    opacity_color=0.10,
    opacity_grid=0.10,
    m_avg=True,
    caption=caption,
    y_label="Mean Reconstruction Error",
    legend_label=legend_label,
)