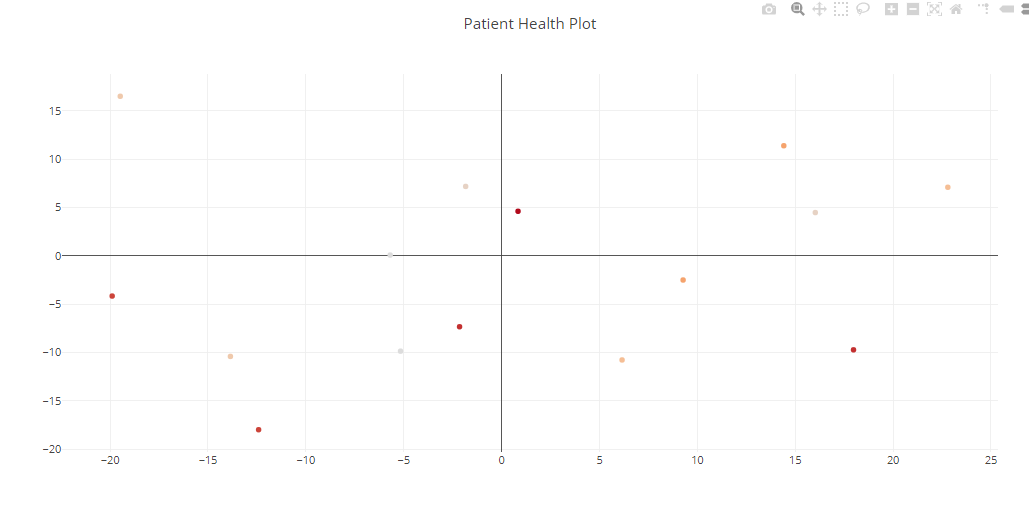
Hi, so I have made a scatter plot in using Plotly Express, shown below:

fig = px.scatter(x=x, y=y, color=color, symbol = symbol,
                title = 'Patient Health Plot',
                 labels = {'color':'Patient', 'symbol':'Time','size':'Severity', '0':labels['0'], '1':labels['1']},
                 size = size)
Here each data is in the form of a Numpy array. I am working on a project where I have to plot the data using PlotlyJS on a react app (I know Dash would be the one stop solution, but my teammate  is working on a react app). So I have created a flask api which sends all of the data as a json, so that we can plot the same on Frontend using PlotlyJS.
However, I am unable to replicate the entire graph in PlotlyJS, I’ve searched a lot in documentation, but could not find a help, neither in Stackoverflow
Here is the code in JS till now:
import React, { Component } from 'react'
import './page.css'
import Plotly from "plotly.js-basic-dist";
import createPlotlyComponent from "react-plotly.js/factory";
const Plot = createPlotlyComponent(Plotly);

export default class PCA extends Component {
  render() {
    return (
      <div className='PCA'>
        PCA
        <Plot
          data={[
            {
              x: [-5.691238139127018,
                16.02561825924827,
              -19.482347122543963,
                22.79664620239432,
                9.27281358669174,
              -19.89458153037701,
              -2.1475704679740293,
                0.8395889051651714,
              -5.162839175882285,
              -1.8356646308243358,
              -13.854581667215033,
                6.155185565188921,
                14.41696750169902,
              -12.413456433571344,
                17.97832792203258,
              -7.002868774905083],
              y: [0.078247758751456,
                4.471210394686129,
                16.496418817153604,
                7.088318145789984,
                -2.501368997923566,
                -4.159977694060695,
                -7.335497257865577,
                4.605541034829036,
                -9.85701386098633,
                7.174241441255795,
                -10.40241299755566,
                -10.76765189142554,
                11.382045078953835,
                -17.98191393628625,
                -9.722118669880018],
              hovertemplate: '<br><b>Patient</b>: %{marker.color}<br>' +
                '<br><b>Severity</b>: <b>%{marker.size}</b>'+
                '<br><b>Time</b>: <b>%TODO</b>',
              text: ["Text A", "Text B", "Text C", "Text D", "Text E"],
              showlegend: false,
              mode: 'markers',
              type: 'scatter',
              marker: {
              size:[0.1, 0.1, 0.1, 0.1, 0.1, 0.1, 0.1, 0.1, 0.6306122448979591, 0.7530612244897958, 0.3857142857142857, 1.0999999999999999, 0.5897959183673469, 0.6306122448979591, 0.1, 0.7530612244897958],
              color: ["1","2","3","4","6","11","12","14","1","2","3","4","6","11","12","14"]
              },
            }
          ]}
          layout={{ width: 1200, height: 600, title: 'Patient Health Plot' }}
        />
      </div>
    )
  }
}
The Issues I am facing are as follows:
- The markers are not visible after giving the size
- I want DISCRETE colors, here it is giving continuous. I learnt in Plotly Express Python that by converting the numbers into strings, we can get discrete colors, but I can not get the same result here in Plotly JS
-
SYMBOLS: In Plotly Express, I passed an array into
symbol:(which consisted of two entities S and E, so it automatically assigned Circle and Diamond to it as shown in the first picture), but I am unable to do it in plotlyJS.
Kindly help, I am really stuck into replicating the same in PlotlyJS, thanks.