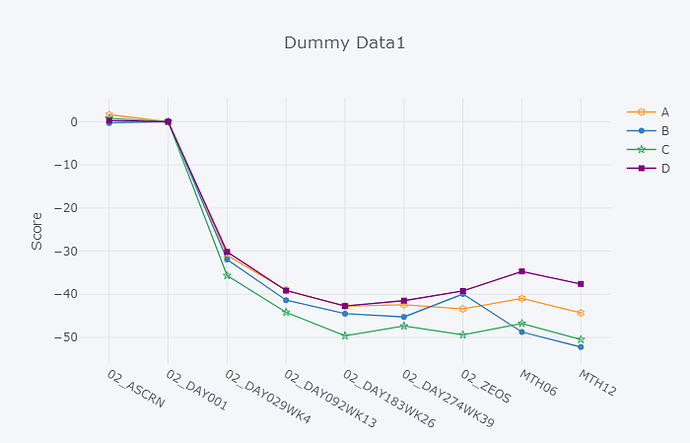
I am trying to create subplots in plotly. I have created graphs in plotly using the code below(screenshots attached below as well), but I can’t seem to get them to work using subplots
I create many of these types of data graphs and any help in tightening my code would be much appreciated.
Here is a sample dataset [NOTE: it is not the exact same dataset I used to generate the graphs below, but close enough]:
| subjid_raw | studyarm | visit | pn_chg | fx_chg | totw_chg |
|---|---|---|---|---|---|
| 20001 | B | 02_ASCRN | -1 | -28 | -30 |
| 20001 | B | 02_DAY001 | 0 | 0 | 0 |
| 20001 | B | 02_DAY029WK4 | -12 | -56 | -76 |
| 20001 | B | 02_DAY092WK13 | -17 | -61 | -88 |
| 20001 | B | 02_DAY183WK26 | -19 | -64 | -93 |
| 20001 | B | 02_DAY274WK39 | -13 | -45 | -65 |
| 20001 | B | 02_ZEOS | -22 | -70 | -102 |
| 20001 | B | MTH06 | -22 | -74 | -108 |
| 20001 | B | MTH12 | -23 | -74 | -109 |
| 20005 | C | 02_ASCRN | 3 | 8 | 12 |
| 20005 | C | 02_DAY001 | 0 | 0 | 0 |
| 20005 | C | 02_DAY029WK4 | -20 | -80 | -112 |
| 20005 | C | 02_DAY092WK13 | -16 | -68 | -95 |
| 20005 | C | 02_DAY183WK26 | -22 | -69 | -99 |
| 20005 | C | 02_DAY274WK39 | -19 | -71 | -103 |
| 20005 | C | 02_ZEOS | -4 | -26 | -36 |
| 20005 | C | MTH06 | -17 | -76 | -105 |
| 20005 | C | MTH12 | -22 | -72 | -106 |
| 20007 | D | 02_ASCRN | -13 | 2 | -12 |
| 20007 | D | 02_DAY001 | 0 | 0 | 0 |
| 20007 | D | 02_DAY029WK4 | 6 | -15 | -45 |
| 20007 | D | 02_DAY092WK13 | -10 | -26 | -39 |
| 20007 | D | 02_DAY183WK26 | -19 | -72 | -97 |
| 20007 | D | 02_DAY274WK39 | -4 | -30 | -35 |
| 20007 | D | 02_ZEOS | -25 | -71 | -103 |
| 20007 | D | MTH12 | -24 | -85 | -117 |
| 20010 | A | 02_ASCRN | -5 | -2 | -6 |
| 20010 | A | 02_DAY001 | 0 | 0 | 0 |
| 20010 | A | 02_DAY029WK4 | -24 | -75 | -102 |
| 20010 | A | 02_DAY092WK13 | -3 | 1 | -1 |
| 20010 | A | 02_DAY183WK26 | -2 | 7 | 6 |
| 20010 | A | 02_DAY274WK39 | 1 | 9 | 13 |
| 20010 | A | 02_ZEOS | -6 | -1 | -7 |
SPECIFIC ASK: I would like to have the subplots show as a subplot with two rows and two columns AND only one legend for the entire graph.
import pandas as pd ##(version: 0.22.0)
import numpy as np ##(version: 1.14.0)

import plotly.graph_objs as go
import plotly.tools as tls
from plotly.offline import *
import cufflinks as cf ##(version: 0.12.1)

init_notebook_mode(connected=True)
cf.go_offline()


dummy_data = pd.read_csv("desktop\dummy_data.csv")

a = dummy_data.groupby(['studyarm', 'visit']) ['fx_chg'].mean().unstack('studyarm').drop(['02_UNSCH','ZEOS'])
b = dummy_data.groupby(['studyarm', 'visit']) ['pn_chg'].mean().unstack('studyarm').drop(['02_UNSCH','ZEOS'])
c = dummy_data.groupby(['studyarm', 'visit']) ['totw_chg'].mean().unstack('studyarm').drop(['02_UNSCH','ZEOS'])

fig3 = a.iplot(kind='line', yTitle='Score', title='Dummy Data1', mode=markers, asFigure=True)
fig3['data'][0]['marker']['symbol'] = 'hexagram-open-dot'
fig3['data'][1]['marker']['symbol'] = 'circle-dot'
fig3['data'][2]['marker']['symbol'] = 'star-open-dot'
fig3['data'][3]['marker']['symbol'] = 'square'
iplot(fig3, filename='simple-plot')

fig4 = b.iplot(kind='line', yTitle='Score', title='Dummy Data2', mode=markers, asFigure=True)
fig4['data'][0]['marker']['symbol'] = 'hexagram-open-dot'
fig4['data'][1]['marker']['symbol'] = 'circle-dot'
fig4['data'][2]['marker']['symbol'] = 'star-open-dot'
fig4['data'][3]['marker']['symbol'] = 'square'
iplot(fig4, filename='simple-plot')

fig5 = c.iplot(kind='line', yTitle='Score', title='Dummy Data3', mode=markers, asFigure=True)
fig5['data'][0]['marker']['symbol'] = 'hexagram-open-dot'
fig5['data'][1]['marker']['symbol'] = 'circle-dot'
fig5['data'][2]['marker']['symbol'] = 'star-open-dot'
fig5['data'][3]['marker']['symbol'] = 'square'
iplot(fig5, filename='simple-plot')

## I have tried all forms of
##fig = tls.make_subplots(rows=n, cols=n) ##but it just shows graphs as blank?
Below are screenshots of what the graphs look like using the code, but I would like to get them in a 2 row / 2 column subplot format.
UPDATED: I used the following code (credit to Maximilian Peters over at Stack Overflow) to get cufflinks to work but it is repeating the legend even when i use legend equals False (and gives me the picture below):
dummy_data = pd.read_csv("desktop\dummy_data.csv")

a = dummy_data.groupby(['studyarm', 'visit'])['fx_chg'].mean().unstack('studyarm').drop(['02_UNSCH','ZEOS'])
b = dummy_data.groupby(['studyarm', 'visit'])['pn_chg'].mean().unstack('studyarm').drop(['02_UNSCH','ZEOS'])
c = dummy_data.groupby(['studyarm', 'visit'])['totw_chg'].mean().unstack('studyarm').drop(['02_UNSCH','ZEOS'])

fig6 = a.iplot(mode=markers, asFigure=True)
fig6['data'][0]['marker']['symbol'] = 'hexagram-open-dot'
fig6['data'][1]['marker']['symbol'] = 'circle-dot'
fig6['data'][2]['marker']['symbol'] = 'star-open-dot'
fig6['data'][3]['marker']['symbol'] = 'square'

fig7 = b.iplot(mode=markers, asFigure=True)
fig7['data'][0]['marker']['symbol'] = 'hexagram-open-dot'
fig7['data'][1]['marker']['symbol'] = 'circle-dot'
fig7['data'][2]['marker']['symbol'] = 'star-open-dot'
fig7['data'][3]['marker']['symbol'] = 'square'

fig8 = c.iplot(mode=markers, asFigure=True)
fig8['data'][0]['marker']['symbol'] = 'hexagram-open-dot'
fig8['data'][1]['marker']['symbol'] = 'circle-dot'
fig8['data'][2]['marker']['symbol'] = 'star-open-dot'
fig8['data'][3]['marker']['symbol'] = 'square'

data = [fig6, fig7, fig8]

cf.subplots(data, subplot_titles=('Function', 'Pain', 'Total')).iplot()
UPDATED ASK: How can I add padding between the graphs and only show the legend once? I have added ‘legend equals False’ at each figure level as well as legend equals false at the iplot level (which is for the entire graph and removes the legend entirely).
Cufflinks may be the easiest answer, but I would like to get more than just my own opinion on this.


