TickText not working

Hello!

I’m trying to relabel my X-Axis values and thought ticktext would take care of that, however I’m not entirly sure that’s the proper way to achieve this.

I’m trying to get my labels to go from:
8_20_1, 8_25_1, 8_30_1
To:
8/20, 8/25, 8/30

Current State of X-Axis:

Current Python Code:

    layout = dict(
            width = 900,
            heigth = 900,
            legend = dict(
                x = .75,
                y = 1                    
            ),
            xaxis = dict(
                showgrid = False,
                zeroline=True,
                showline=True,
                title = "Date",
                titlefont = dict(
                        size = 20,
                        color = "#000"
                ),
                tickfont = dict(
                        size = 14,
                        color = "#000"
                ),
                ticktext = ['8/20','8/25', '8/30','9/4','9/14','9/19','9/24','9/29'],
                dtick=30,
                        
            ),

Thank you!

1 Like

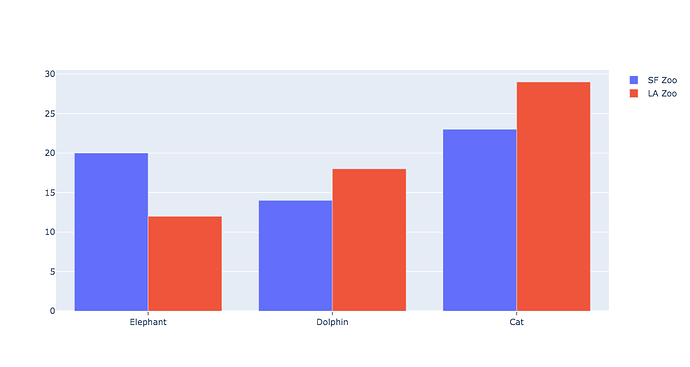
Same problem over here. Trying to rename on the x-axis:

giraffes as Elephant
orangutans as Dolphin
monkeys as Cat

import plotly.graph_objects as go
animals=['giraffes', 'orangutans', 'monkeys']

fig = go.Figure(data=[
    go.Bar(name='SF Zoo', x=animals, y=[20, 14, 23]),
    go.Bar(name='LA Zoo', x=animals, y=[12, 18, 29])
])

# Change the bar mode
fig.update_layout(barmode='group')


fig.update_xaxes(tickmode='array', ticktext=["Elephant", "Dolphin", "Cat"], ticks="outside")


fig.show()

Why is this not working?

My fault, this works

import plotly.graph_objects as go
animals=['giraffes', 'orangutans', 'monkeys']

fig = go.Figure(data=[
    go.Bar(name='SF Zoo', x=animals, y=[20, 14, 23]),
    go.Bar(name='LA Zoo', x=animals, y=[12, 18, 29])
])

# Change the bar mode
fig.update_layout(barmode='group')


fig.update_xaxes(tickmode='array', ticktext=["Elephant", "Dolphin", "Cat"], ticks="outside",
                tickvals=["giraffes", "orangutans", "monkeys"])


fig.show()